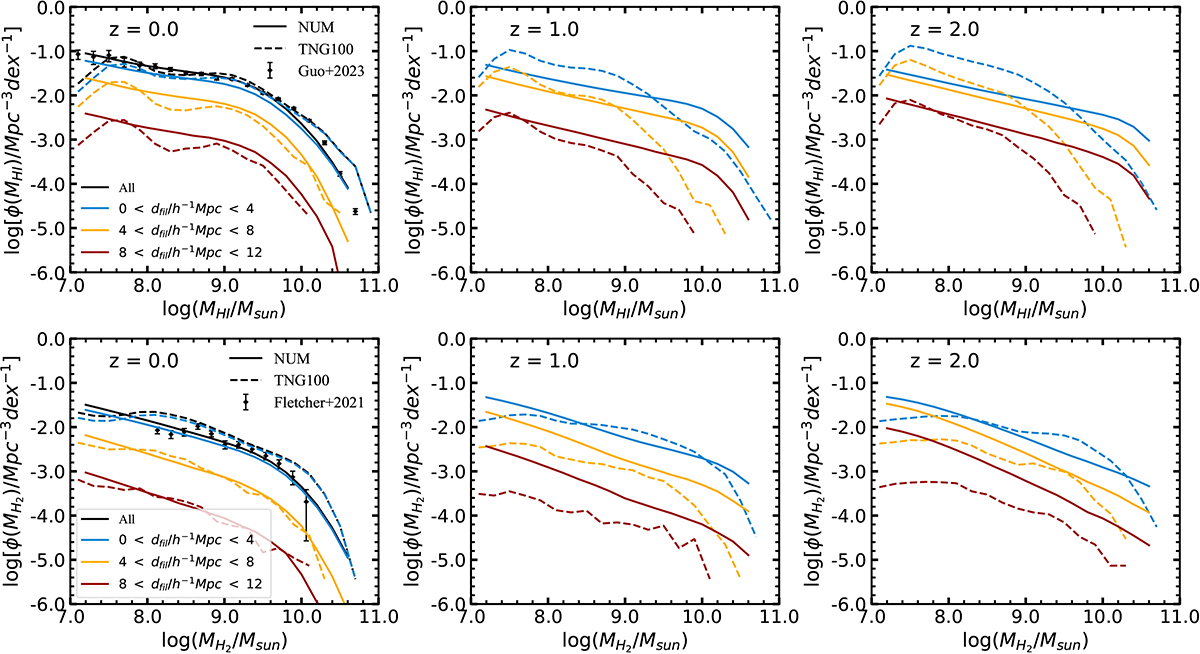
Fig. 2.
Download original image
Comparisons of HIMF (top row) and H2MF (bottom row) between NUM model and TNG100 for z = 0 (left panels), z = 1 (middle panels), and z = 2 (right panels). We add observational measurements of HIMF in Guo et al. (2023) and H2MF in Fletcher et al. (2021) at z = 0 for reference in the top left panel and bottom left panel, respectively; these are shown as black dots with error bars. NUM model and TNG100 results are represented by solid and dashed lines, while the results of different distances to filaments are shown by different colours: black for all galaxies, blue for 0 < dfil/h−1 Mpc < 4, orange for 4 < dfil/h−1 Mpc < 8, and red for 8 < dfil/h−1 Mpc < 12.
Current usage metrics show cumulative count of Article Views (full-text article views including HTML views, PDF and ePub downloads, according to the available data) and Abstracts Views on Vision4Press platform.
Data correspond to usage on the plateform after 2015. The current usage metrics is available 48-96 hours after online publication and is updated daily on week days.
Initial download of the metrics may take a while.