Fig. 1.
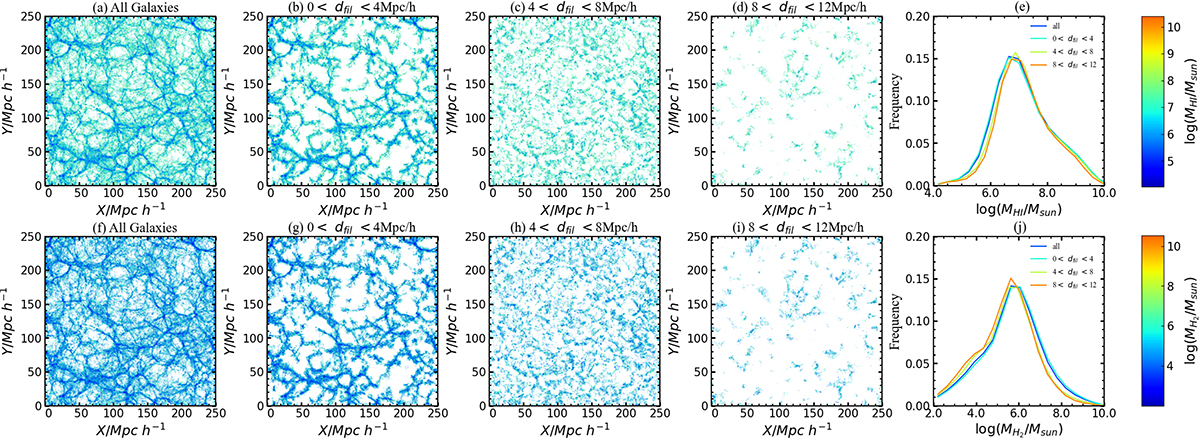
Download original image
Galaxy distribution in NUM catalogue at z = 0. Top row: Panels a to d, colour-coded by H I mass, show the distribution for all galaxies (panel a), galaxies with with 0 < dfil/h−1 Mpc < 4 (panel b), 4 < dfil/h−1 Mpc < 8 (panel c), and 8 < dfil/h−1 Mpc < 12 (panel d), respectively. Panel e shows the H I mass distribution for galaxies with different distances to the filament that are measured within the same thin slice as in panels a–d; these are blue for all galaxies, cyan for 0 < dfil/h−1 Mpc < 4, green for 4 < dfil/h−1 Mpc < 8, and orange for 8 < dfil/h−1 Mpc < 12. The bottom row is the same as top row, but colour-coded by H2 mass.
Current usage metrics show cumulative count of Article Views (full-text article views including HTML views, PDF and ePub downloads, according to the available data) and Abstracts Views on Vision4Press platform.
Data correspond to usage on the plateform after 2015. The current usage metrics is available 48-96 hours after online publication and is updated daily on week days.
Initial download of the metrics may take a while.