Fig. 9
Download original image
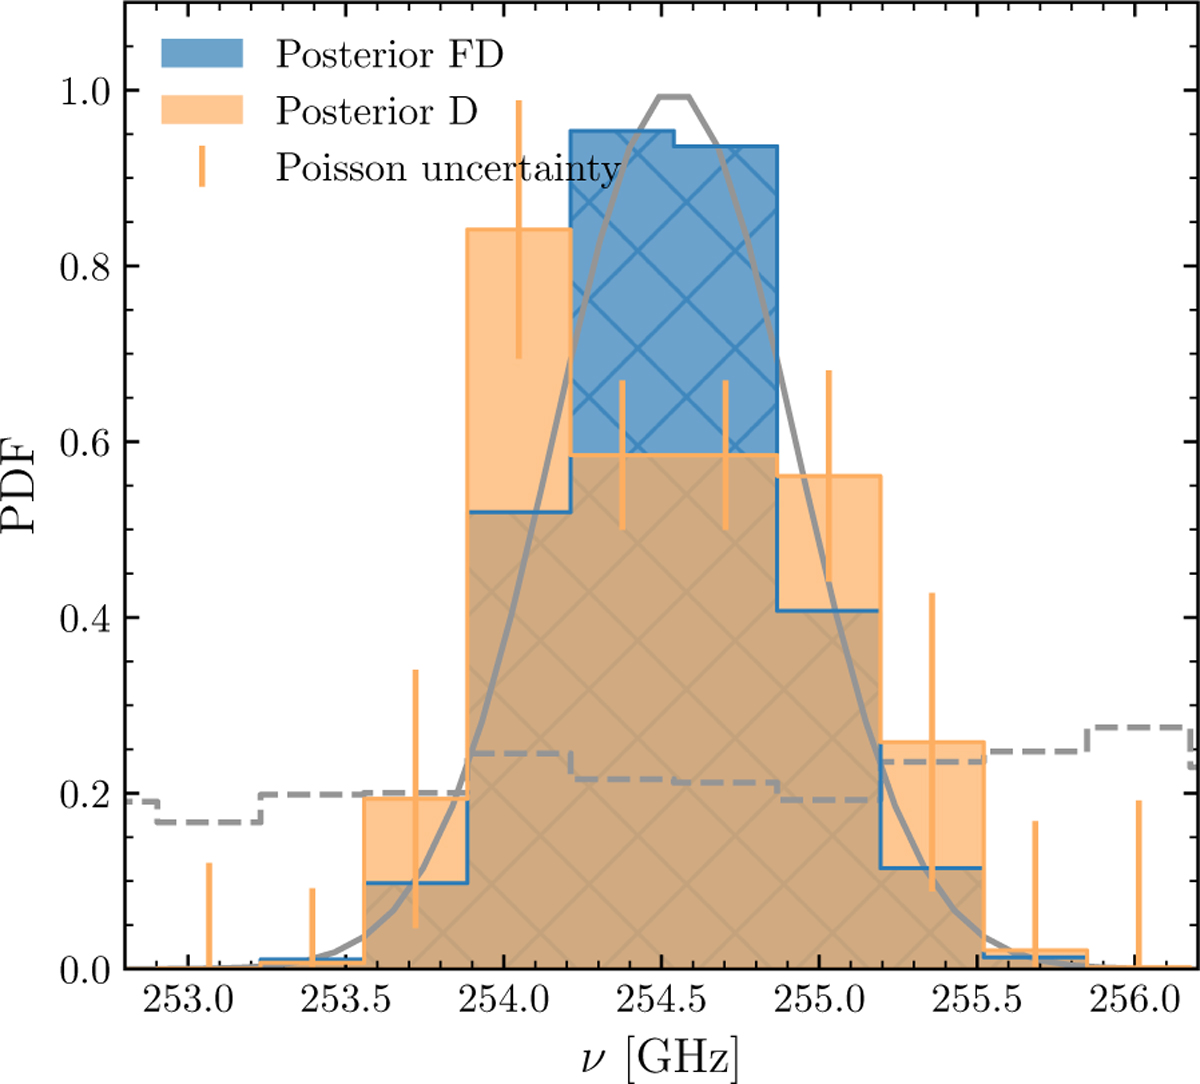
Posterior distribution of peaks above S/N > 2.5 and within 0″.6 of the JWST derived centroid as a function of frequency for both the real and jackknifed realization. The Gaussian prior derived from JWST/MRS Hα observation of Zavala et al. (2025) is shown as the gray line, and the initial PDF of the probability of false detections is the gray-dashed line.
Current usage metrics show cumulative count of Article Views (full-text article views including HTML views, PDF and ePub downloads, according to the available data) and Abstracts Views on Vision4Press platform.
Data correspond to usage on the plateform after 2015. The current usage metrics is available 48-96 hours after online publication and is updated daily on week days.
Initial download of the metrics may take a while.