Fig. 8
Download original image
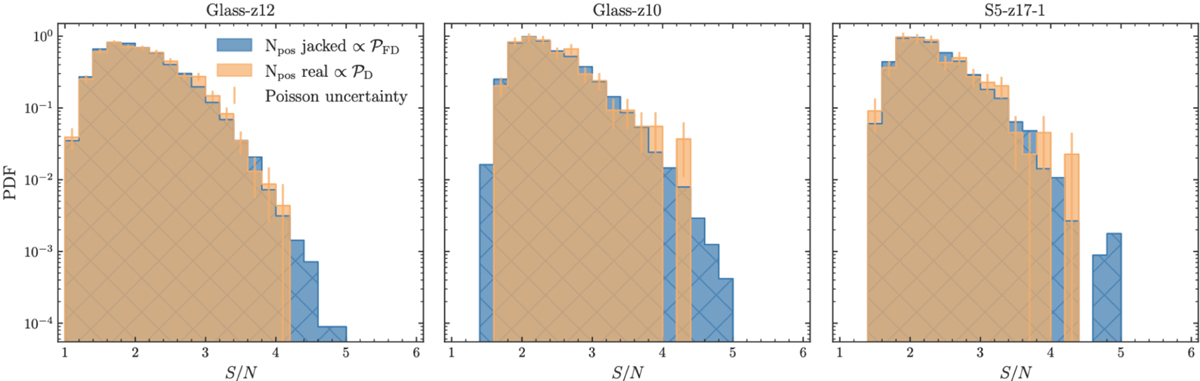
Probability distribution of false detections, ![]() noted as Npos jacked, and the peak value distribution of the observations,
noted as Npos jacked, and the peak value distribution of the observations, ![]() noted as Npos real. Both distributions are obtained by running FindClump on the jackknifed cubes and the real data cube, respectively. From left to right, we show the three data sets of GLASS-z12, GLASS-z10, and S5-z17–1 (see Table 1). An excess of
noted as Npos real. Both distributions are obtained by running FindClump on the jackknifed cubes and the real data cube, respectively. From left to right, we show the three data sets of GLASS-z12, GLASS-z10, and S5-z17–1 (see Table 1). An excess of ![]() over
over ![]() is indicative of line detection. However, no such excess is detected.
is indicative of line detection. However, no such excess is detected.
Current usage metrics show cumulative count of Article Views (full-text article views including HTML views, PDF and ePub downloads, according to the available data) and Abstracts Views on Vision4Press platform.
Data correspond to usage on the plateform after 2015. The current usage metrics is available 48-96 hours after online publication and is updated daily on week days.
Initial download of the metrics may take a while.