Fig. 7
Download original image
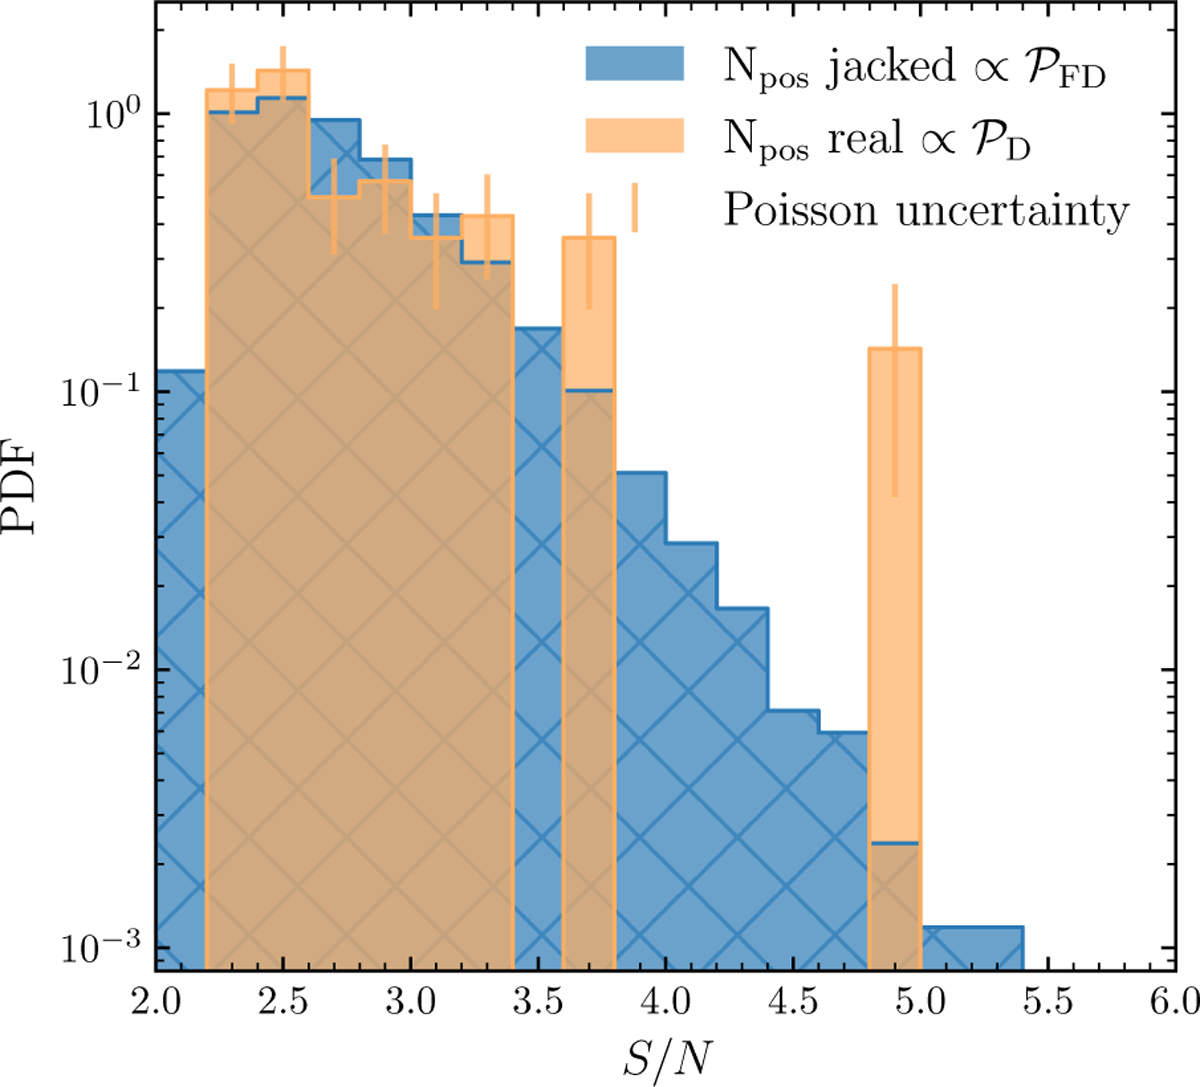
Output of the line finding done on the simulated ALMA observation that had an off-centered line and continuum source, which was initialized to have an integrated S/N of 5 in the integrated velocity map (see Fig. 4). In blue, we show the underlying PDF of a false detection ![]() derived from counting peak values in the jackknifed realizations. In orange, we show the results on the simulated data, which shows a clear detection of the two sources at a S/N = 5. The peak at S/N ≈ 3.6 is consistent with being noise (as explained in the main body of the text).
derived from counting peak values in the jackknifed realizations. In orange, we show the results on the simulated data, which shows a clear detection of the two sources at a S/N = 5. The peak at S/N ≈ 3.6 is consistent with being noise (as explained in the main body of the text).
Current usage metrics show cumulative count of Article Views (full-text article views including HTML views, PDF and ePub downloads, according to the available data) and Abstracts Views on Vision4Press platform.
Data correspond to usage on the plateform after 2015. The current usage metrics is available 48-96 hours after online publication and is updated daily on week days.
Initial download of the metrics may take a while.