Fig. 6
Download original image
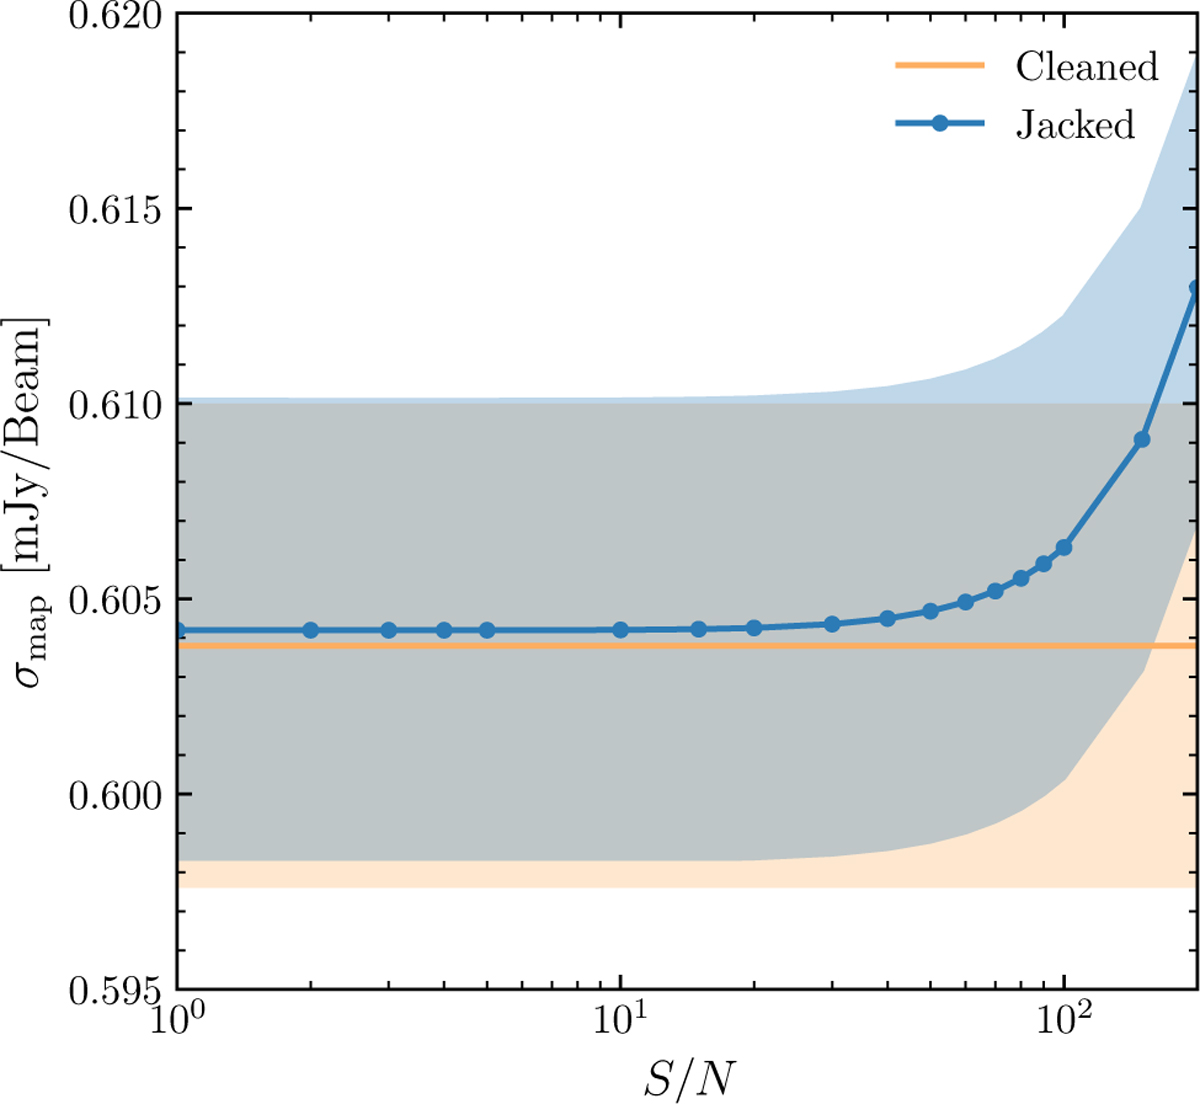
Standard deviation for all maps as a function of the peak S/N of the sources. The blue-shaded region indicates the standard deviation over the various noise estimates from the 50 jackknife realizations for each S/N. The orange-shaded region is the standard deviation over the orange data points in Fig. 5. By jackknifing the observations, we retrieve the noise properties of the cleaned map accurately when the sources have S/N < 50.
Current usage metrics show cumulative count of Article Views (full-text article views including HTML views, PDF and ePub downloads, according to the available data) and Abstracts Views on Vision4Press platform.
Data correspond to usage on the plateform after 2015. The current usage metrics is available 48-96 hours after online publication and is updated daily on week days.
Initial download of the metrics may take a while.