Fig. 3
Download original image
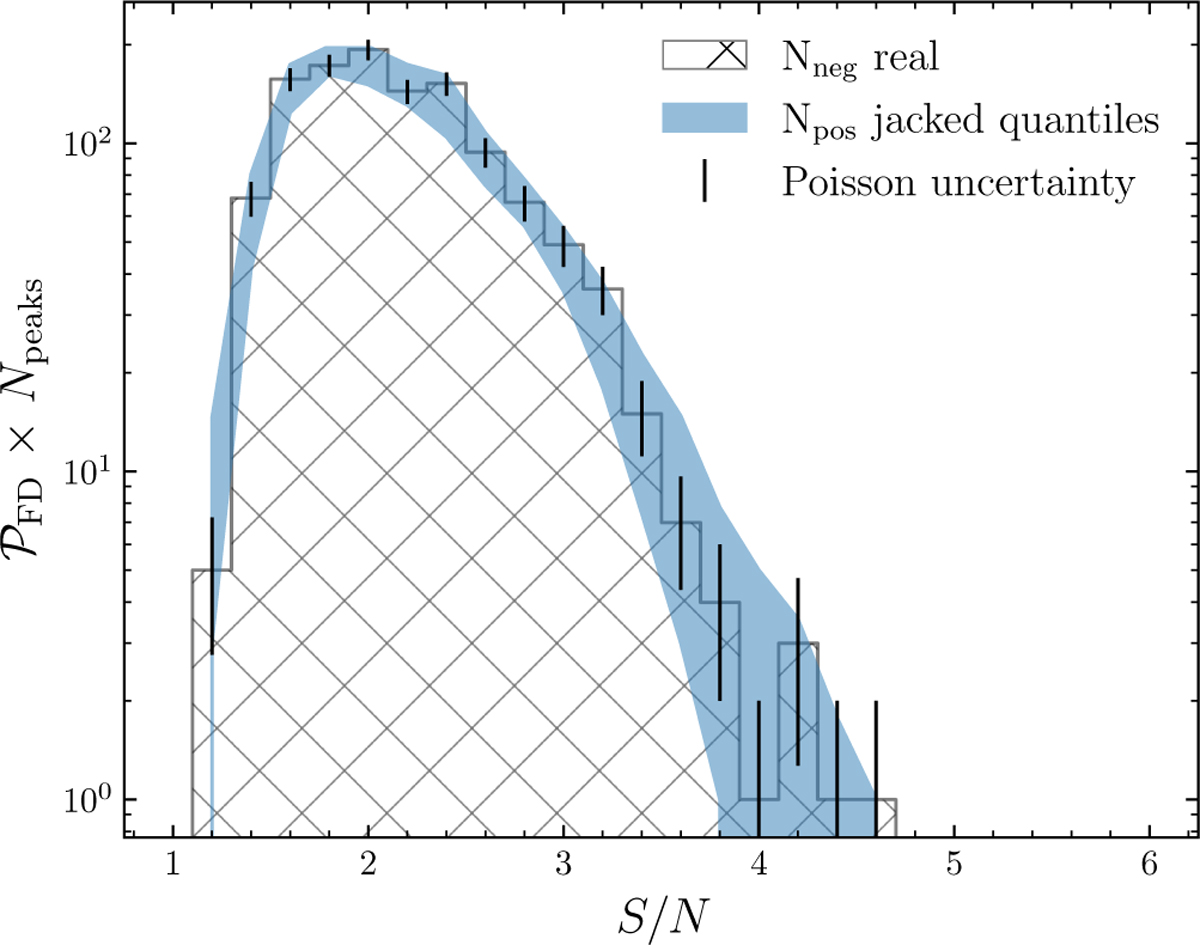
Sampled noise distributions, ![]() , as a function of the peak S/N. The gray hatched histogram shows the results from sampling the number of negative peak values of the original data set (shown with corresponding Poisson uncertainty). The blue-filled region represents the 95% confidence interval of the positive peak values from the jackknife observations.
, as a function of the peak S/N. The gray hatched histogram shows the results from sampling the number of negative peak values of the original data set (shown with corresponding Poisson uncertainty). The blue-filled region represents the 95% confidence interval of the positive peak values from the jackknife observations.
Current usage metrics show cumulative count of Article Views (full-text article views including HTML views, PDF and ePub downloads, according to the available data) and Abstracts Views on Vision4Press platform.
Data correspond to usage on the plateform after 2015. The current usage metrics is available 48-96 hours after online publication and is updated daily on week days.
Initial download of the metrics may take a while.