Open Access
Fig. 7
Download original image
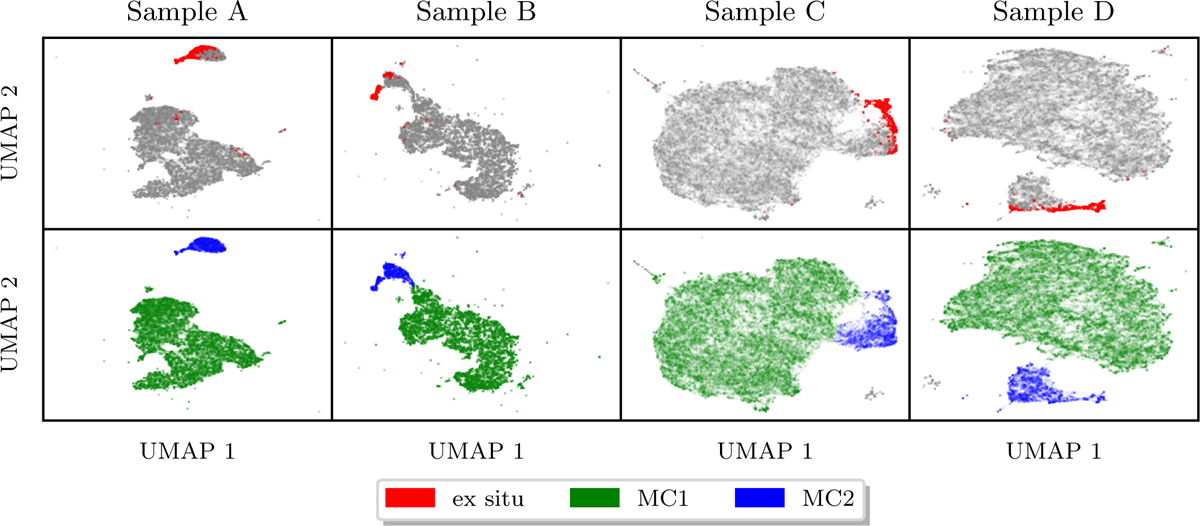
2D UMAP latent space embeddings for samples A, B, C, and D. Top: red dots correspond to ex situ stars (dform > 30 kpc), gray corresponds to everything else. Bottom: selection of major components 1 and 2 (MC1 and MC2) in green and blue, respectively.
Current usage metrics show cumulative count of Article Views (full-text article views including HTML views, PDF and ePub downloads, according to the available data) and Abstracts Views on Vision4Press platform.
Data correspond to usage on the plateform after 2015. The current usage metrics is available 48-96 hours after online publication and is updated daily on week days.
Initial download of the metrics may take a while.