Fig. 1
Download original image
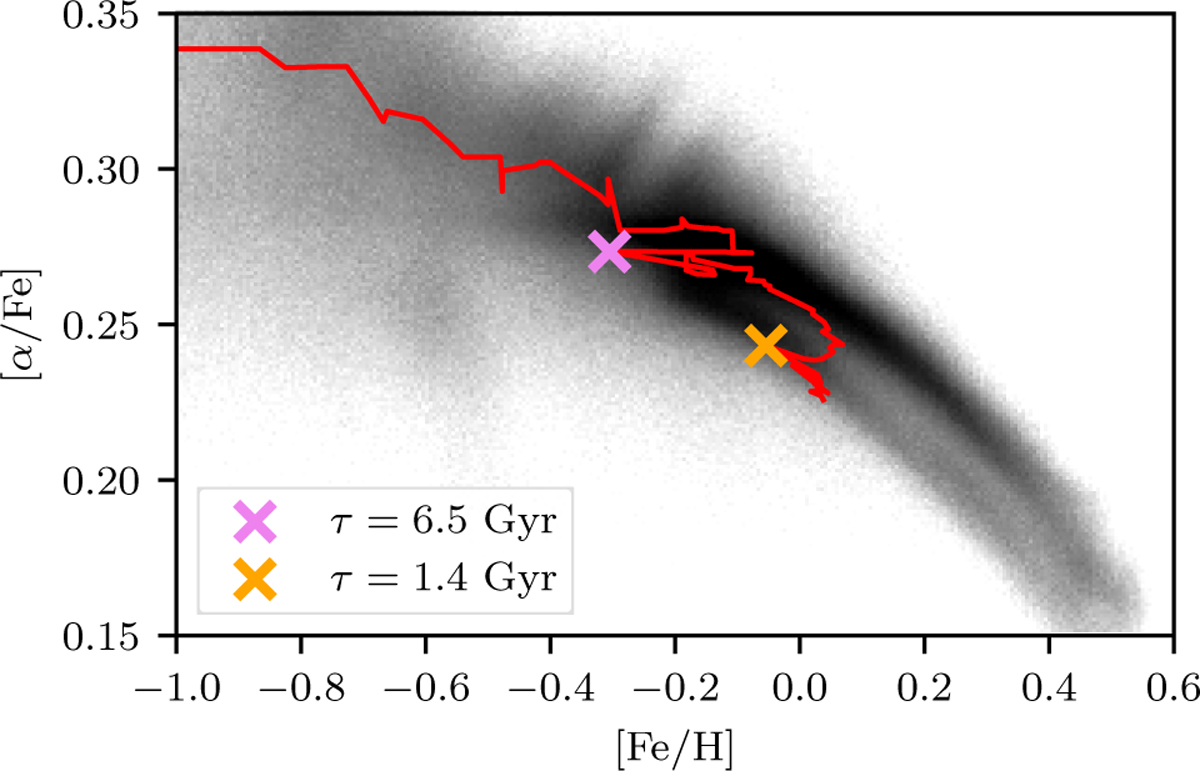
Chemical abundance scatter plot for the redshift z = 0 snapshot of the m12f synthetic galaxy. The red curve traces the average [α/Fe] and [Fe/H] positions in equally spaced intervals of ∆τ = 100 Myr. The tendency is to evolve from the top left to the bottom right, i.e., from high [α/Fe] and low [Fe/H] to low [α/Fe] and high [Fe/H].
Current usage metrics show cumulative count of Article Views (full-text article views including HTML views, PDF and ePub downloads, according to the available data) and Abstracts Views on Vision4Press platform.
Data correspond to usage on the plateform after 2015. The current usage metrics is available 48-96 hours after online publication and is updated daily on week days.
Initial download of the metrics may take a while.