Fig. 9.
Download original image
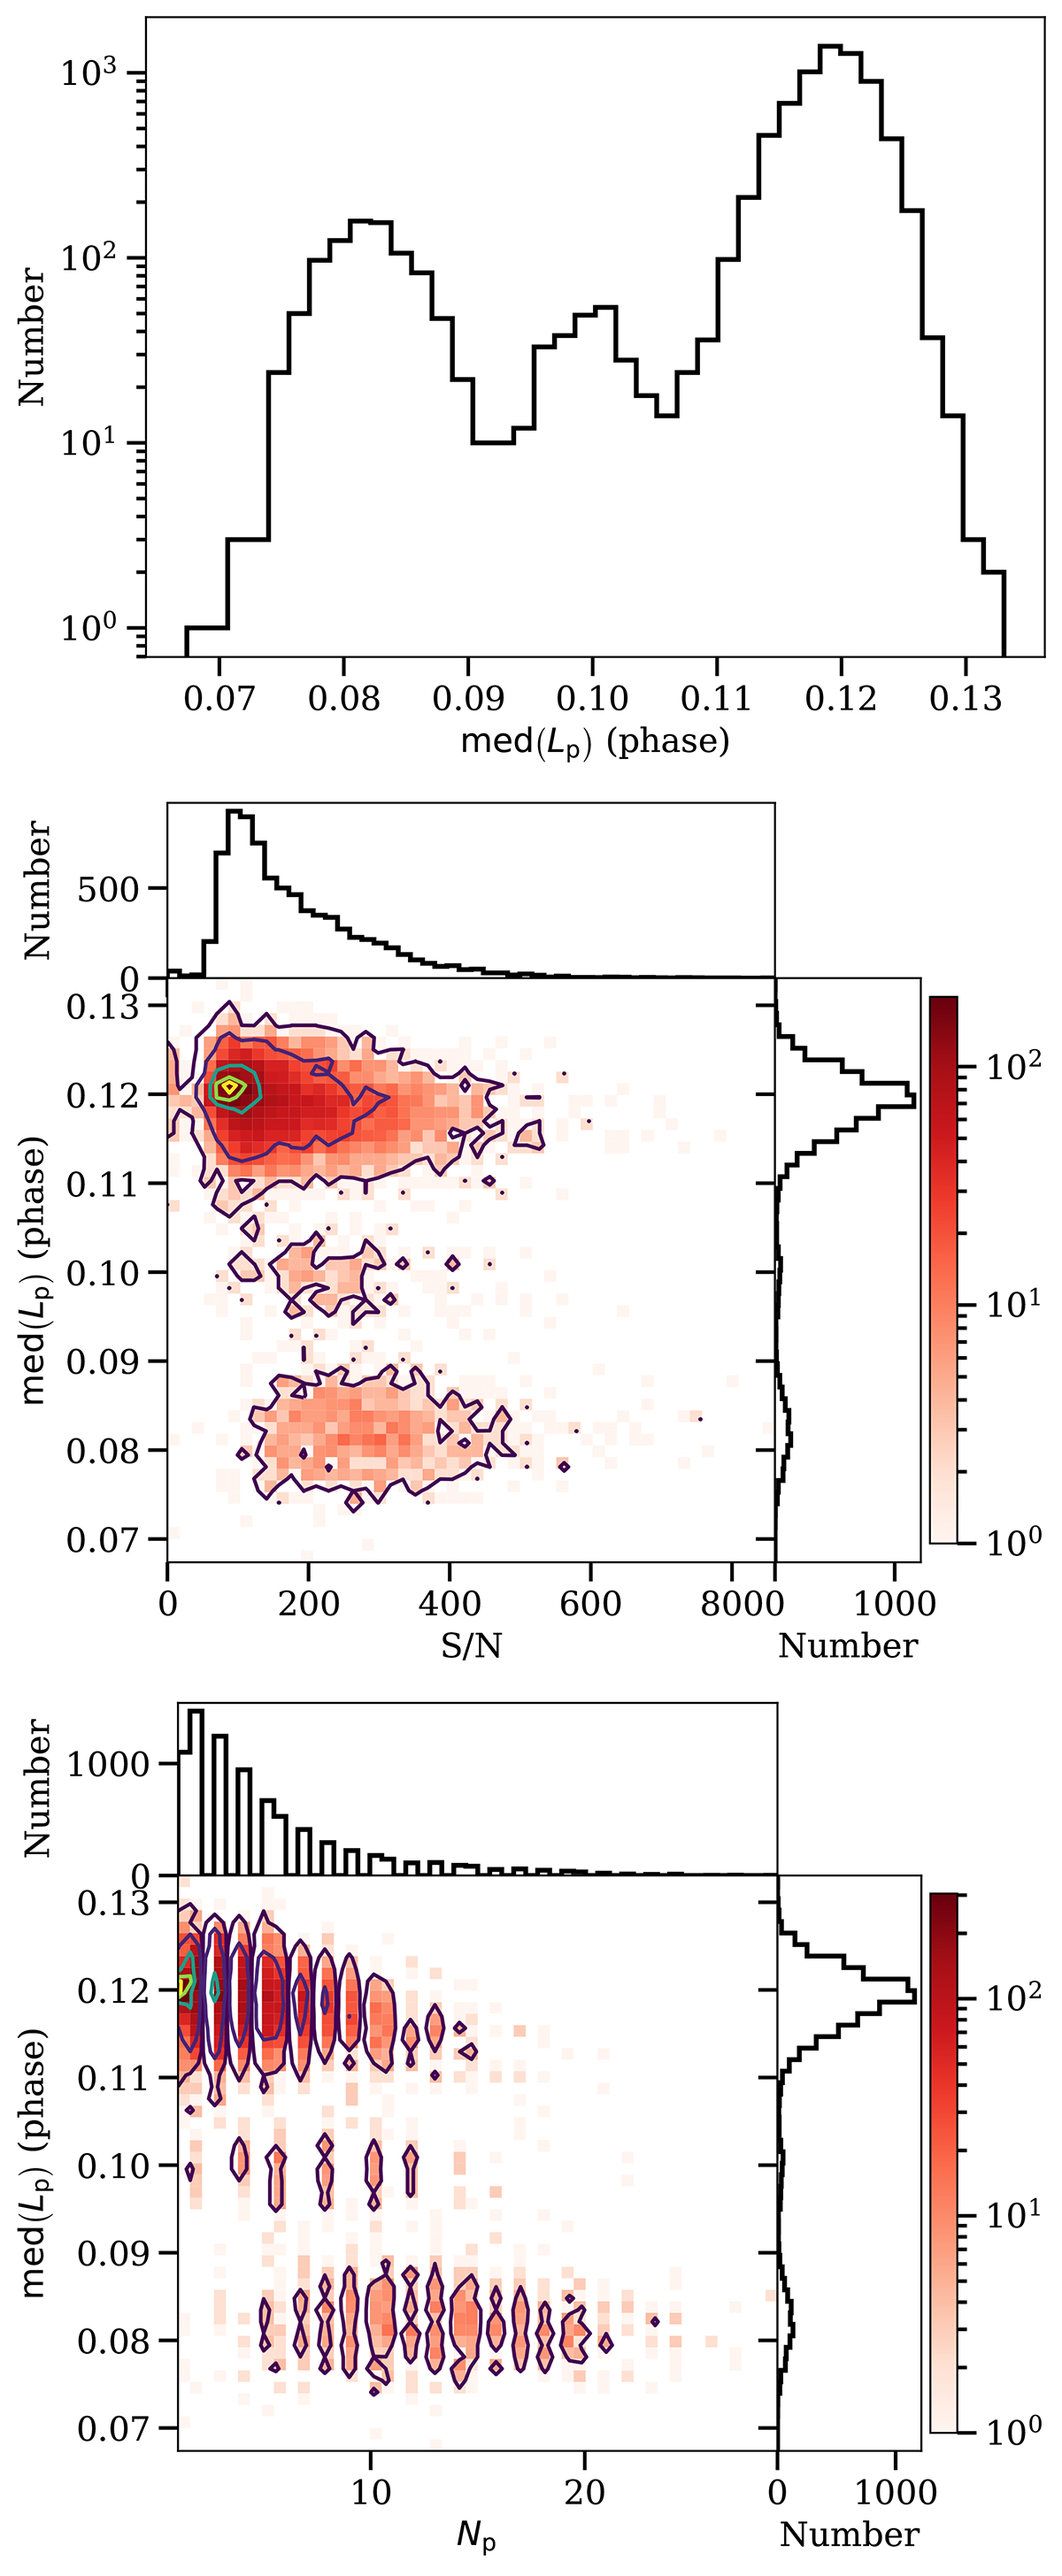
Visual analysis of the number of emission modes present in the data. Top: 1D histogram of the median location of the peaked profile components shown in logarithmic scale. Middle and bottom: Two profile features plotted against each other in 2D (logarithmic scale) and 1D histograms (linear scale) on the sides. We show contours at 1, 10, 50, 75, and 90% of the maximum bin count. The histograms indicate the presence of at least three stable emission modes in the pulsar and independently confirm our conclusions from the Markov model analysis.
Current usage metrics show cumulative count of Article Views (full-text article views including HTML views, PDF and ePub downloads, according to the available data) and Abstracts Views on Vision4Press platform.
Data correspond to usage on the plateform after 2015. The current usage metrics is available 48-96 hours after online publication and is updated daily on week days.
Initial download of the metrics may take a while.