Fig. 8.
Download original image
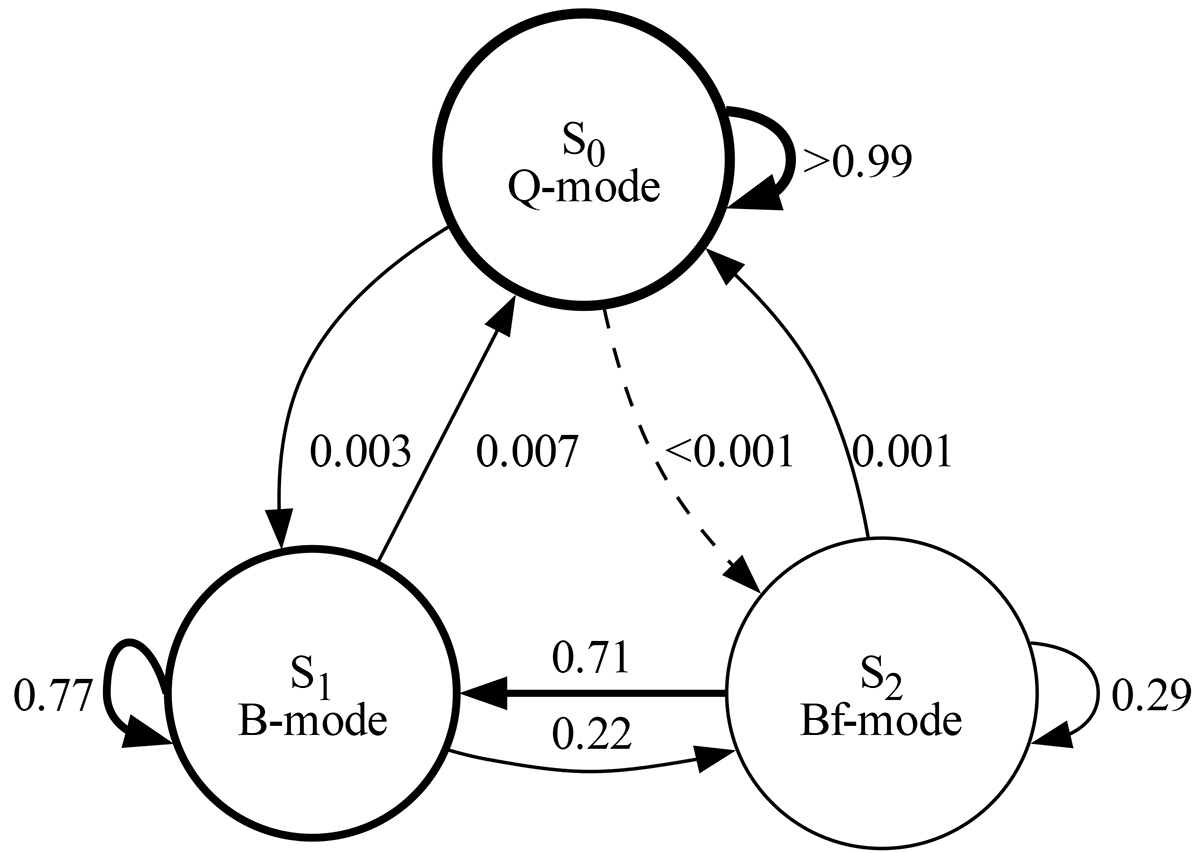
Visualisation of the state transition probabilities of our best-fitting three-state Markov switching model. The circles represent the states, and the arrows represent the state transitions. The line thickness is roughly proportional to the transition probability, with low-probability transitions drawn using dashed lines. The identified states are the quiescent Q-mode, the bright B-mode, and a newly identified flaring Bf-mode.
Current usage metrics show cumulative count of Article Views (full-text article views including HTML views, PDF and ePub downloads, according to the available data) and Abstracts Views on Vision4Press platform.
Data correspond to usage on the plateform after 2015. The current usage metrics is available 48-96 hours after online publication and is updated daily on week days.
Initial download of the metrics may take a while.