Fig. 7.
Download original image
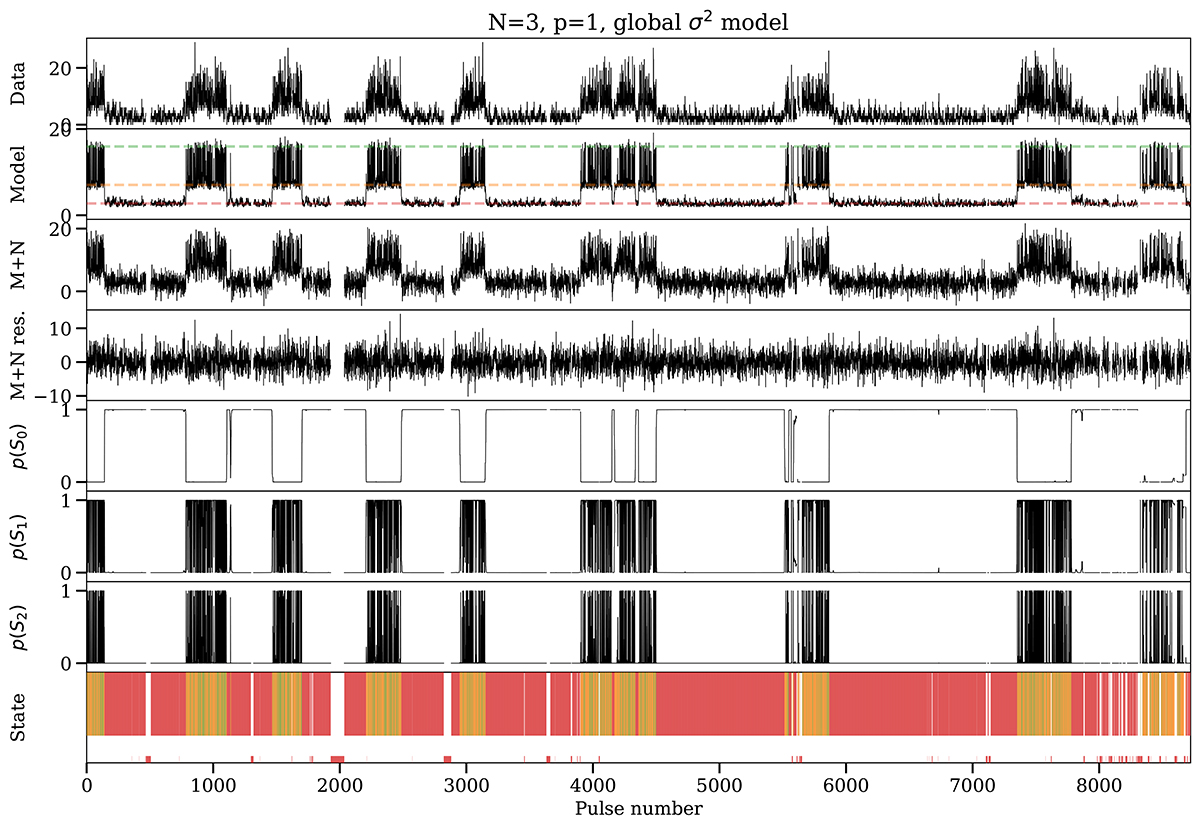
Results from fitting our Markov switching models to our measured Np time series data from the entire 2023-04-24 single-pulse stack. We show the best fit of our three-state model with first-order autoregression and a globally constant variance. The panels show, from top to bottom, the Np time series data, the best-fitting noise-free switching model, the model with added Gaussian white noise with the estimated variance (M+N), the residuals of that (data – M+N), the state probability time series p(St), and the most likely emission state for each rotation coloured separately. Red corresponds to S0, orange to S1, and green to S2. We show the best-fitting state means with dashed lines of the same colour in the model panel. As above, the red vertical markers highlight rotations that were RFI excised. The model describes the data well, with almost white residuals.
Current usage metrics show cumulative count of Article Views (full-text article views including HTML views, PDF and ePub downloads, according to the available data) and Abstracts Views on Vision4Press platform.
Data correspond to usage on the plateform after 2015. The current usage metrics is available 48-96 hours after online publication and is updated daily on week days.
Initial download of the metrics may take a while.