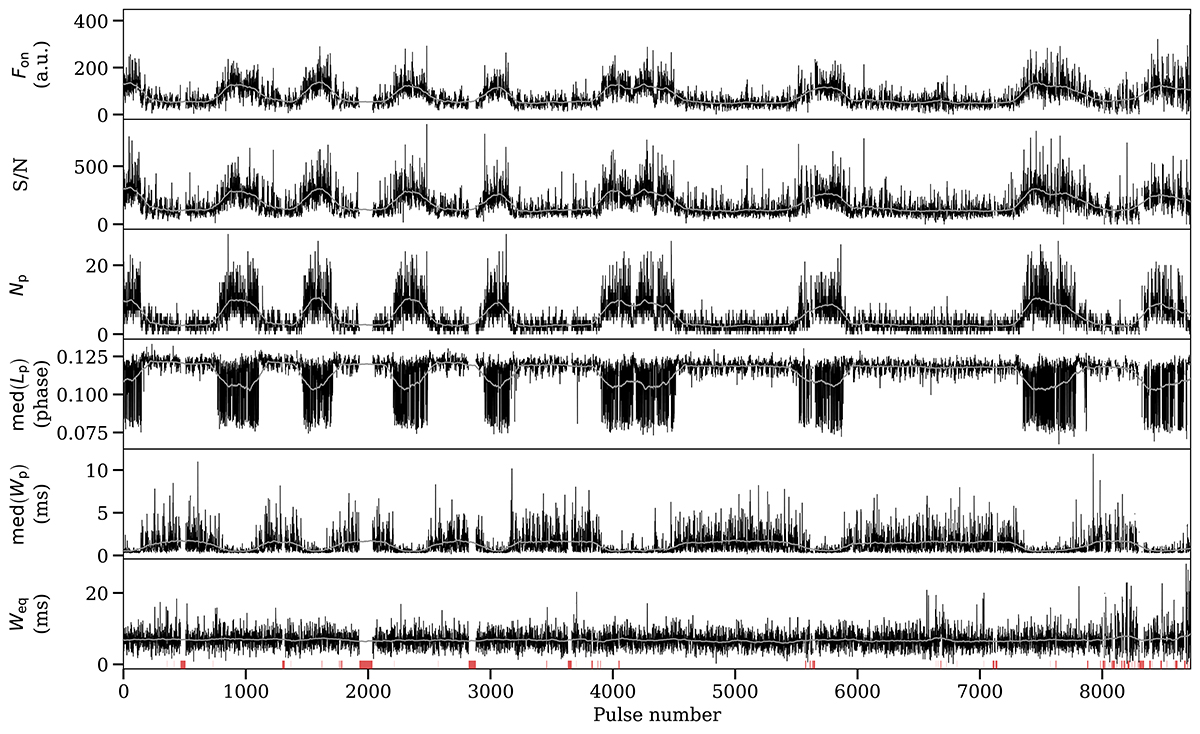
Fig. 6.
Download original image
Timeline showing several measured features from the entire 2023-04-24 single-pulse stack. Specifically, we show time series of the on-pulse fluence Fon in the combined PC and MP phase range, the S/N, the number of peaks Np in the profile, their median locations Lp in pulse phase, their full widths at half prominence Wp, and the boxcar equivalent pulse width Weq. The grey lines depict running mean smoothings of the data using a 150-rotation wide sliding window. The red vertical markers highlight rotations that were RFI excised.
Current usage metrics show cumulative count of Article Views (full-text article views including HTML views, PDF and ePub downloads, according to the available data) and Abstracts Views on Vision4Press platform.
Data correspond to usage on the plateform after 2015. The current usage metrics is available 48-96 hours after online publication and is updated daily on week days.
Initial download of the metrics may take a while.