Open Access
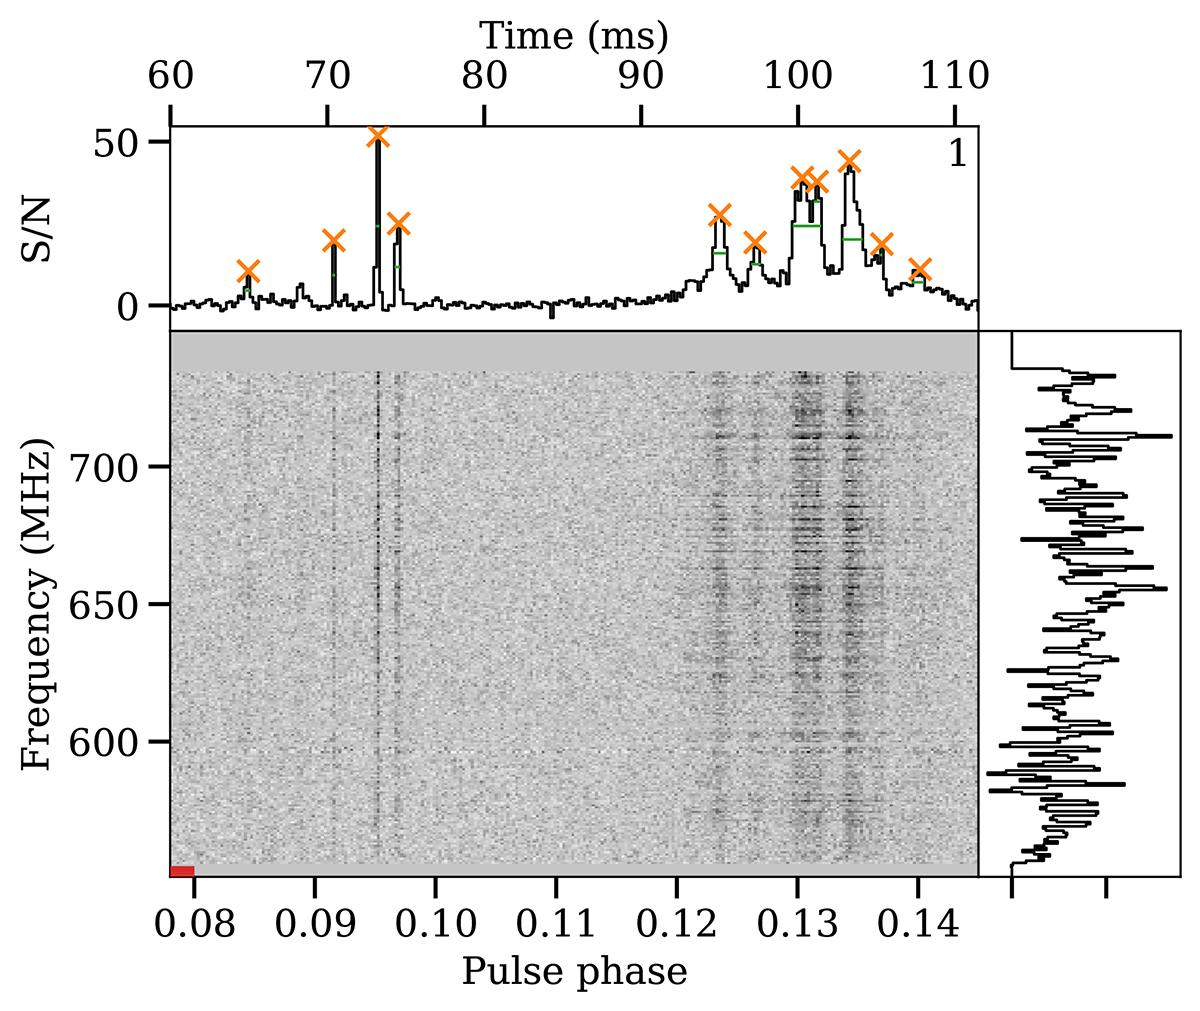
Fig. 5.
Download original image
Example of a single-pulse dynamic spectrum and profile with the significantly peaked profile components and their full widths at half prominence highlighted. The right panel shows the mean power spectral density or radio spectrum in the on-pulse region. A sub-threshold peak is visible in the PC phase window on the left.
Current usage metrics show cumulative count of Article Views (full-text article views including HTML views, PDF and ePub downloads, according to the available data) and Abstracts Views on Vision4Press platform.
Data correspond to usage on the plateform after 2015. The current usage metrics is available 48-96 hours after online publication and is updated daily on week days.
Initial download of the metrics may take a while.