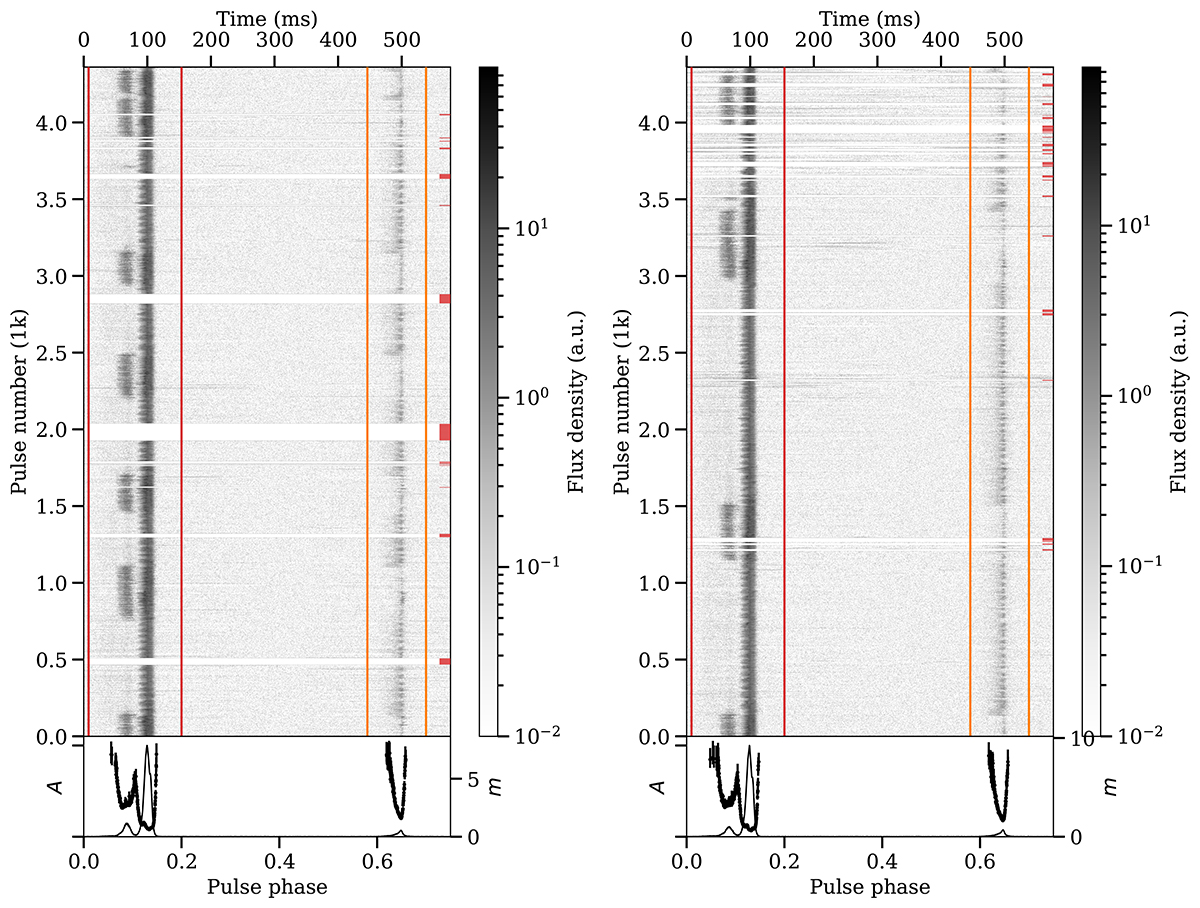
Fig. 3.
Download original image
Single-pulse stacks of PSR B1822−09 from our data taken on 2023-04-24 showing several mode transitions. Each stack contains 56 min of data with a gap of 6 min between them for the phase calibrator scan. We applied a logarithmic greyscale mapping to bring out the faint emission in the IP and around the mode transitions. The vertical coloured lines delimit the two on-pulse phase regions, and the horizontal red lines on the right mark the rotations that were excised. The bottom panels show the normalised mean profile amplitudes A (black solid lines; left scale) and the phase-resolved modulation index m (black error bars; right scale).
Current usage metrics show cumulative count of Article Views (full-text article views including HTML views, PDF and ePub downloads, according to the available data) and Abstracts Views on Vision4Press platform.
Data correspond to usage on the plateform after 2015. The current usage metrics is available 48-96 hours after online publication and is updated daily on week days.
Initial download of the metrics may take a while.