Fig. 2.
Download original image
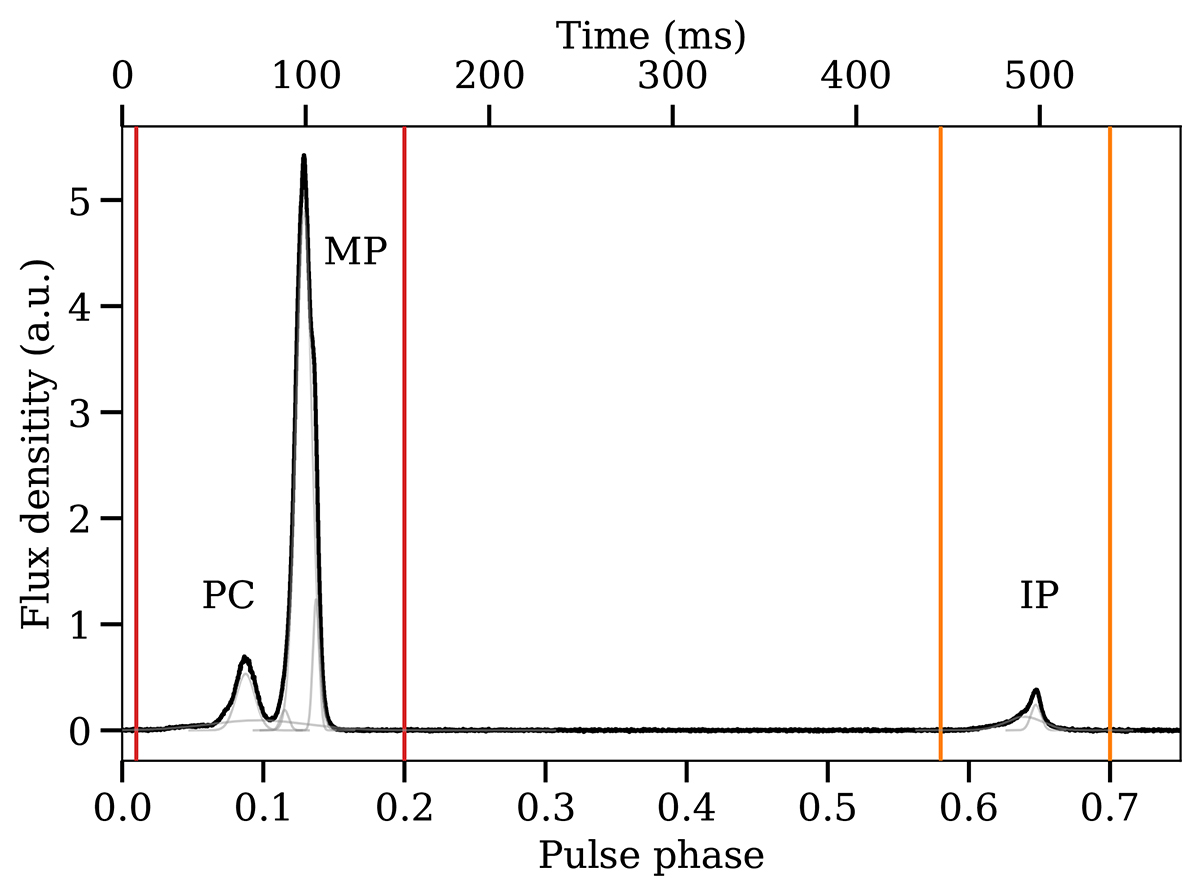
Total integrated pulse profile of PSR B1822−09 formed from our 2023-04-24 data that shows its PC, MP, and IP profile components. The IP is separated by about 0.52 in phase from the MP. The coloured vertical solid lines delineate the two on-pulse phase ranges, and the grey solid lines show our best decomposition into seven von Mises distribution sub-components.
Current usage metrics show cumulative count of Article Views (full-text article views including HTML views, PDF and ePub downloads, according to the available data) and Abstracts Views on Vision4Press platform.
Data correspond to usage on the plateform after 2015. The current usage metrics is available 48-96 hours after online publication and is updated daily on week days.
Initial download of the metrics may take a while.