Fig. 19.
Download original image
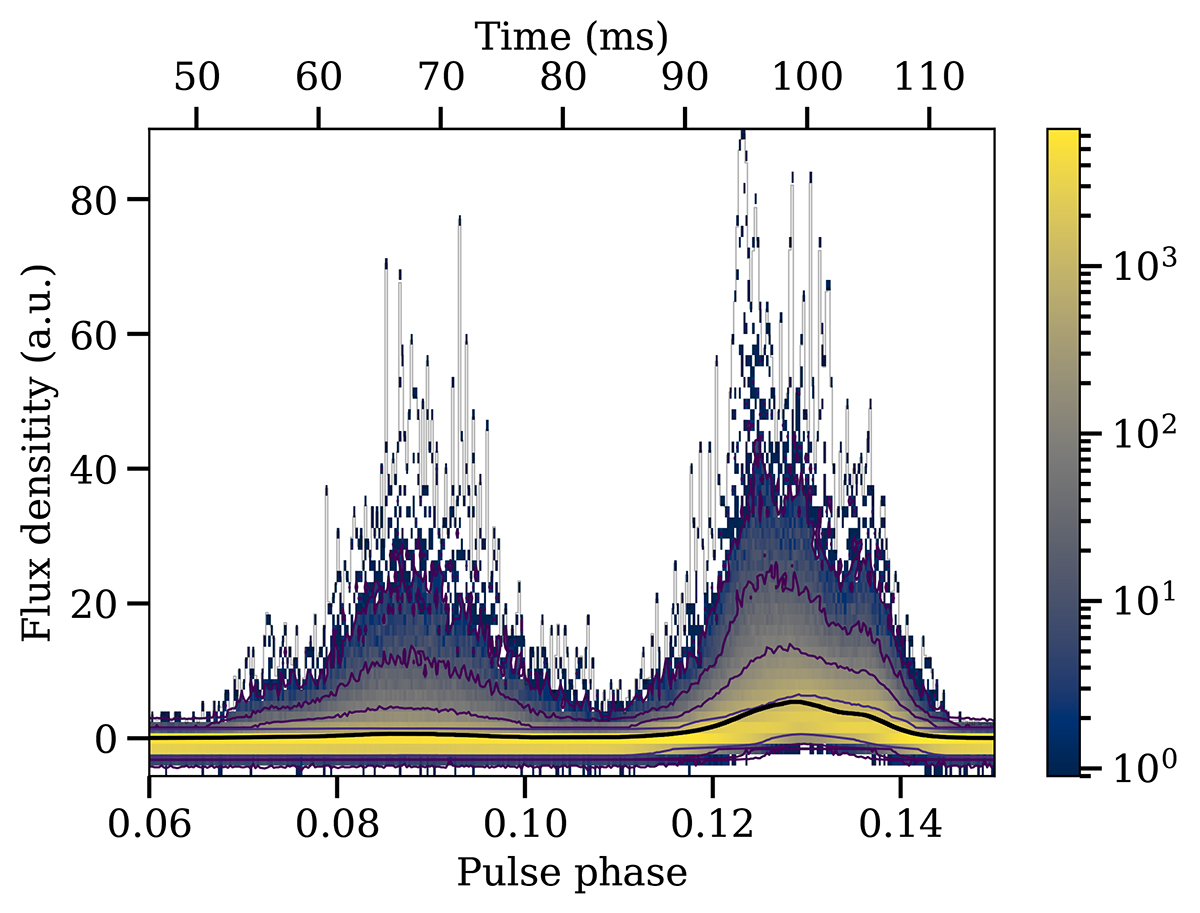
Phase-resolved single-pulse amplitude distribution of the PC and MP phase range. We show the mode-averaged 2D amplitude-phase distribution, that is, the number of pulses per flux density and phase bin, displayed on a logarithmic colour scale. The black solid line that peaks near 5 a.u. is the same average pulse profile as shown in Fig. 2, the grey solid line represents the maximum amplitude, and the coloured solid lines are logarithmically spaced contours of the 2D distribution.
Current usage metrics show cumulative count of Article Views (full-text article views including HTML views, PDF and ePub downloads, according to the available data) and Abstracts Views on Vision4Press platform.
Data correspond to usage on the plateform after 2015. The current usage metrics is available 48-96 hours after online publication and is updated daily on week days.
Initial download of the metrics may take a while.