Fig. 17.
Download original image
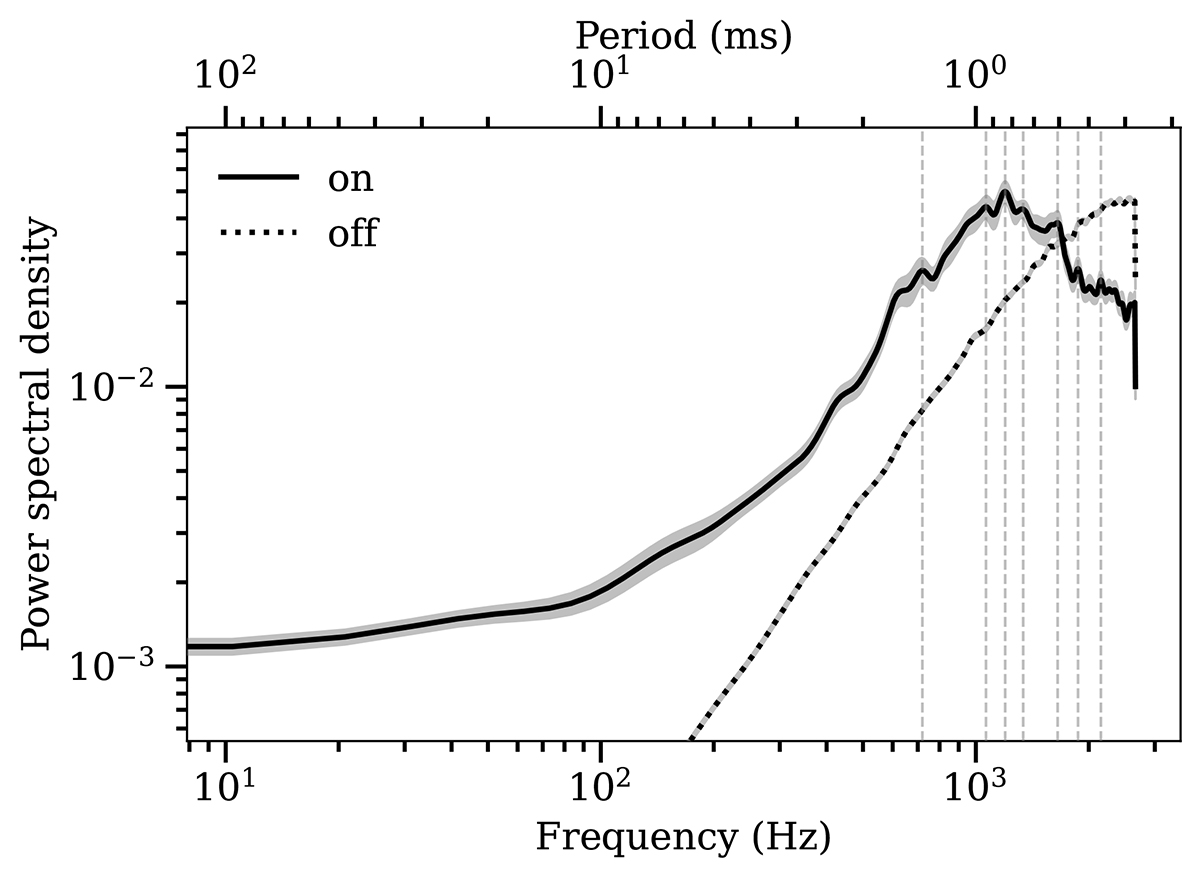
Fourier power spectral density averaged over 59 single pulses that exhibit extensive quasi-periodic microstructure in the PC profile component. The black solid line shows the sample mean, and the grey shaded area its standard error for the combined PC and MP on-pulse phase range. The black dotted line is the same for the off-pulse region. The grey dashed lines mark significant features. The dominant feature occurs near 1200 Hz or 0.83 ms.
Current usage metrics show cumulative count of Article Views (full-text article views including HTML views, PDF and ePub downloads, according to the available data) and Abstracts Views on Vision4Press platform.
Data correspond to usage on the plateform after 2015. The current usage metrics is available 48-96 hours after online publication and is updated daily on week days.
Initial download of the metrics may take a while.