Open Access
Fig. 16.
Download original image
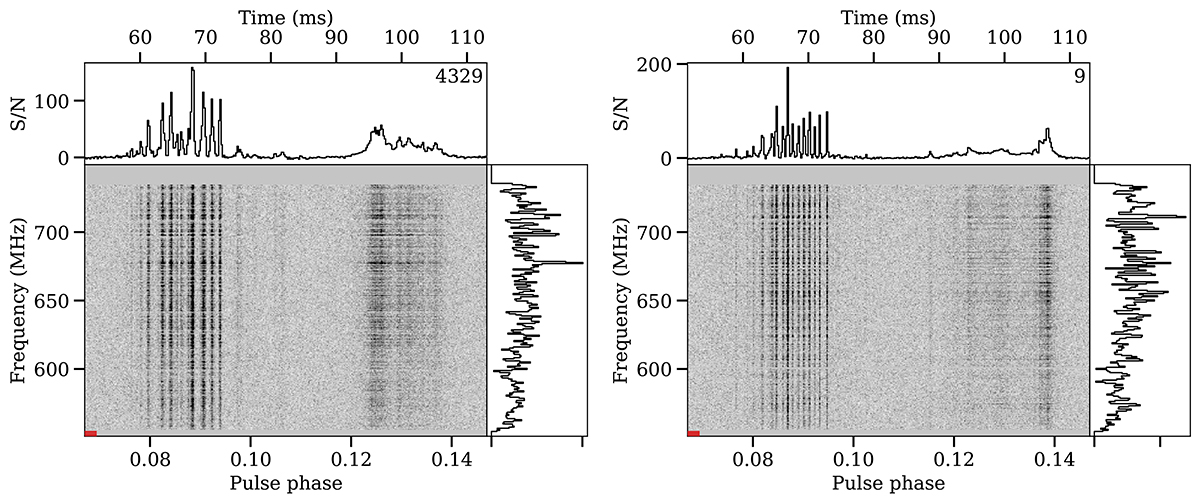
Dedispersed dynamic spectra of two example single pulses that exhibit extensive quasi-periodic microstructure in the PC profile component. We zoomed into the PC and MP phase range as in Fig. 15. The quasi-periodic microstructure is clearly visible in the PC pulse envelope.
Current usage metrics show cumulative count of Article Views (full-text article views including HTML views, PDF and ePub downloads, according to the available data) and Abstracts Views on Vision4Press platform.
Data correspond to usage on the plateform after 2015. The current usage metrics is available 48-96 hours after online publication and is updated daily on week days.
Initial download of the metrics may take a while.