Fig. 15.
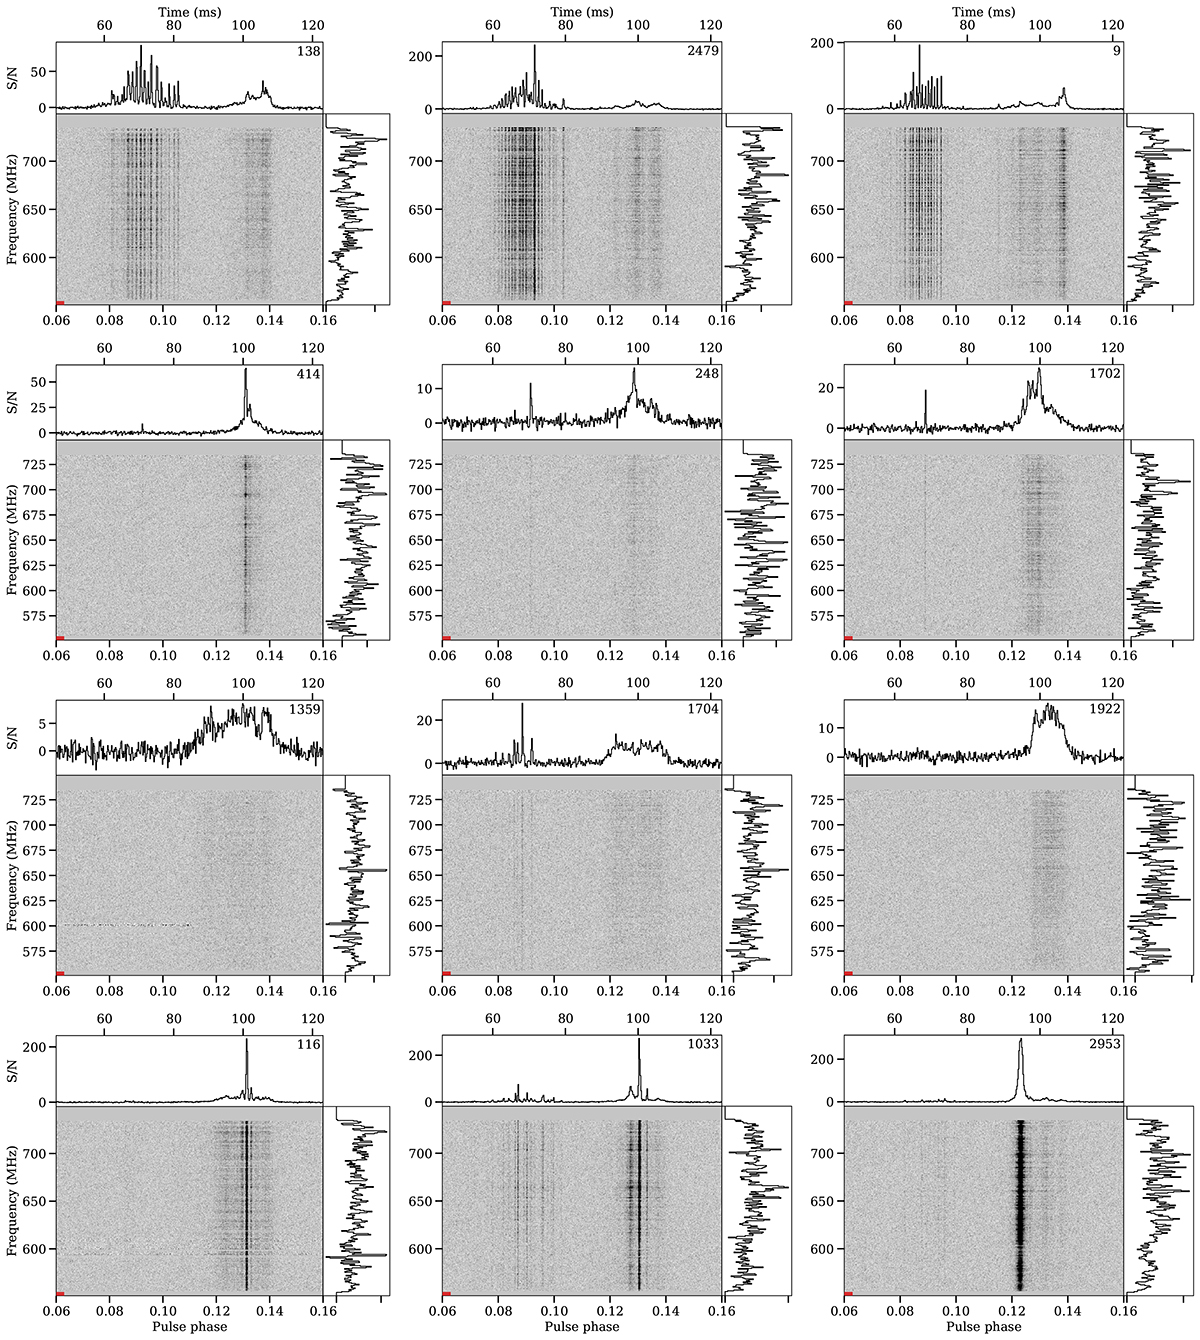
Download original image
Three representative examples of single pulses exhibiting extensive quasi-periodic microstructure (top row), low-level PC activity within long stretches of Q-mode emission (second row), low-intensity square-like pulses (third row), and extremely bright pulse components (bottom row) as observed in the PC and MP phase range. We display the pulse numbers in the top-right corner of the profile panels. The dedispersed dynamic spectra are saturated at the same intensity in each panel.
Current usage metrics show cumulative count of Article Views (full-text article views including HTML views, PDF and ePub downloads, according to the available data) and Abstracts Views on Vision4Press platform.
Data correspond to usage on the plateform after 2015. The current usage metrics is available 48-96 hours after online publication and is updated daily on week days.
Initial download of the metrics may take a while.