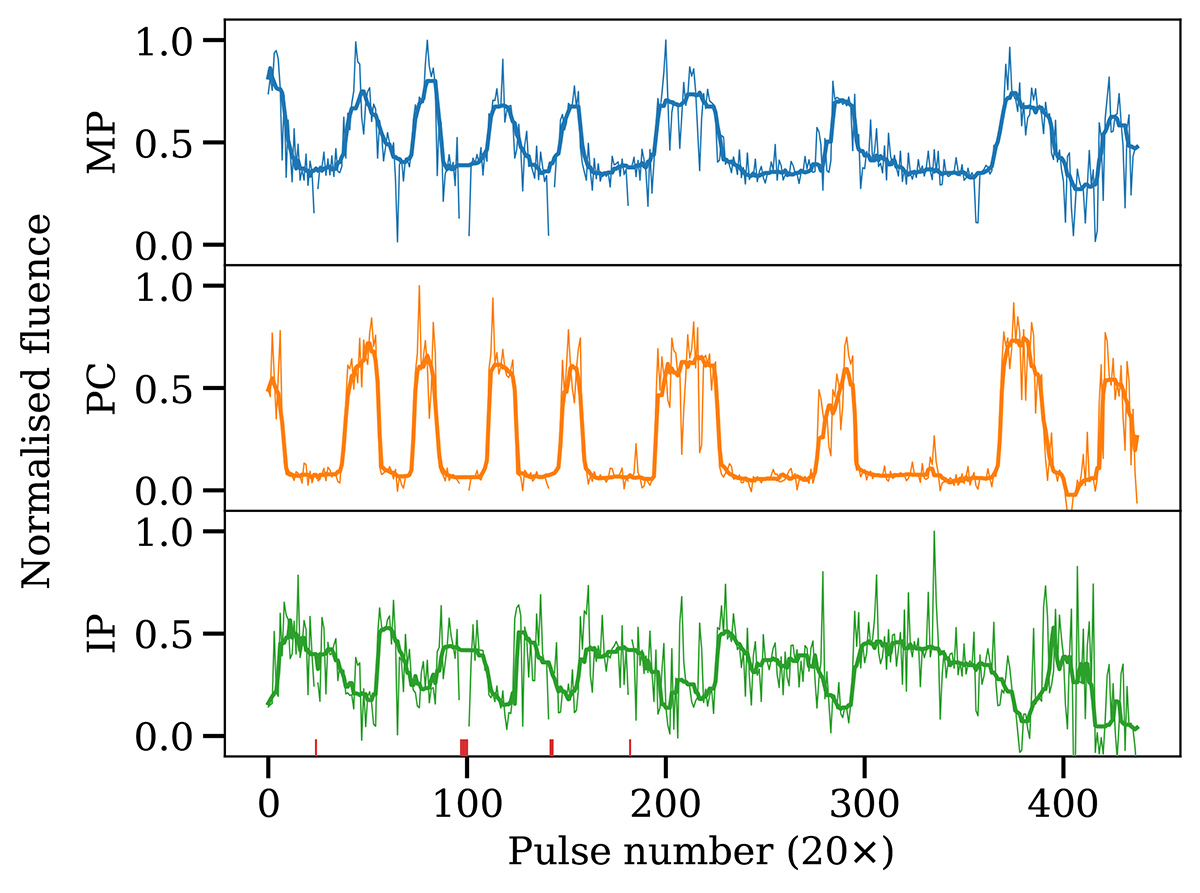
Fig. 14.
Download original image
Correlation analysis between the emission in the MP, PC, and IP phase regions. We show the time series of the measured on-pulse fluences normalised by their individual maxima, where we averaged every 20 pulses for clarity. The solid lines depict running median smoothings of the data using ten-sample wide sliding windows. The red markers at the bottom highlight integrations that were excised. The MP and PC components switch fluence synchronously to each other, while the IP switches asynchronously to both the PC and MP. The latter strongly suggests a feedback mechanism between the polar caps on opposite sides of the star.
Current usage metrics show cumulative count of Article Views (full-text article views including HTML views, PDF and ePub downloads, according to the available data) and Abstracts Views on Vision4Press platform.
Data correspond to usage on the plateform after 2015. The current usage metrics is available 48-96 hours after online publication and is updated daily on week days.
Initial download of the metrics may take a while.