Fig. 13.
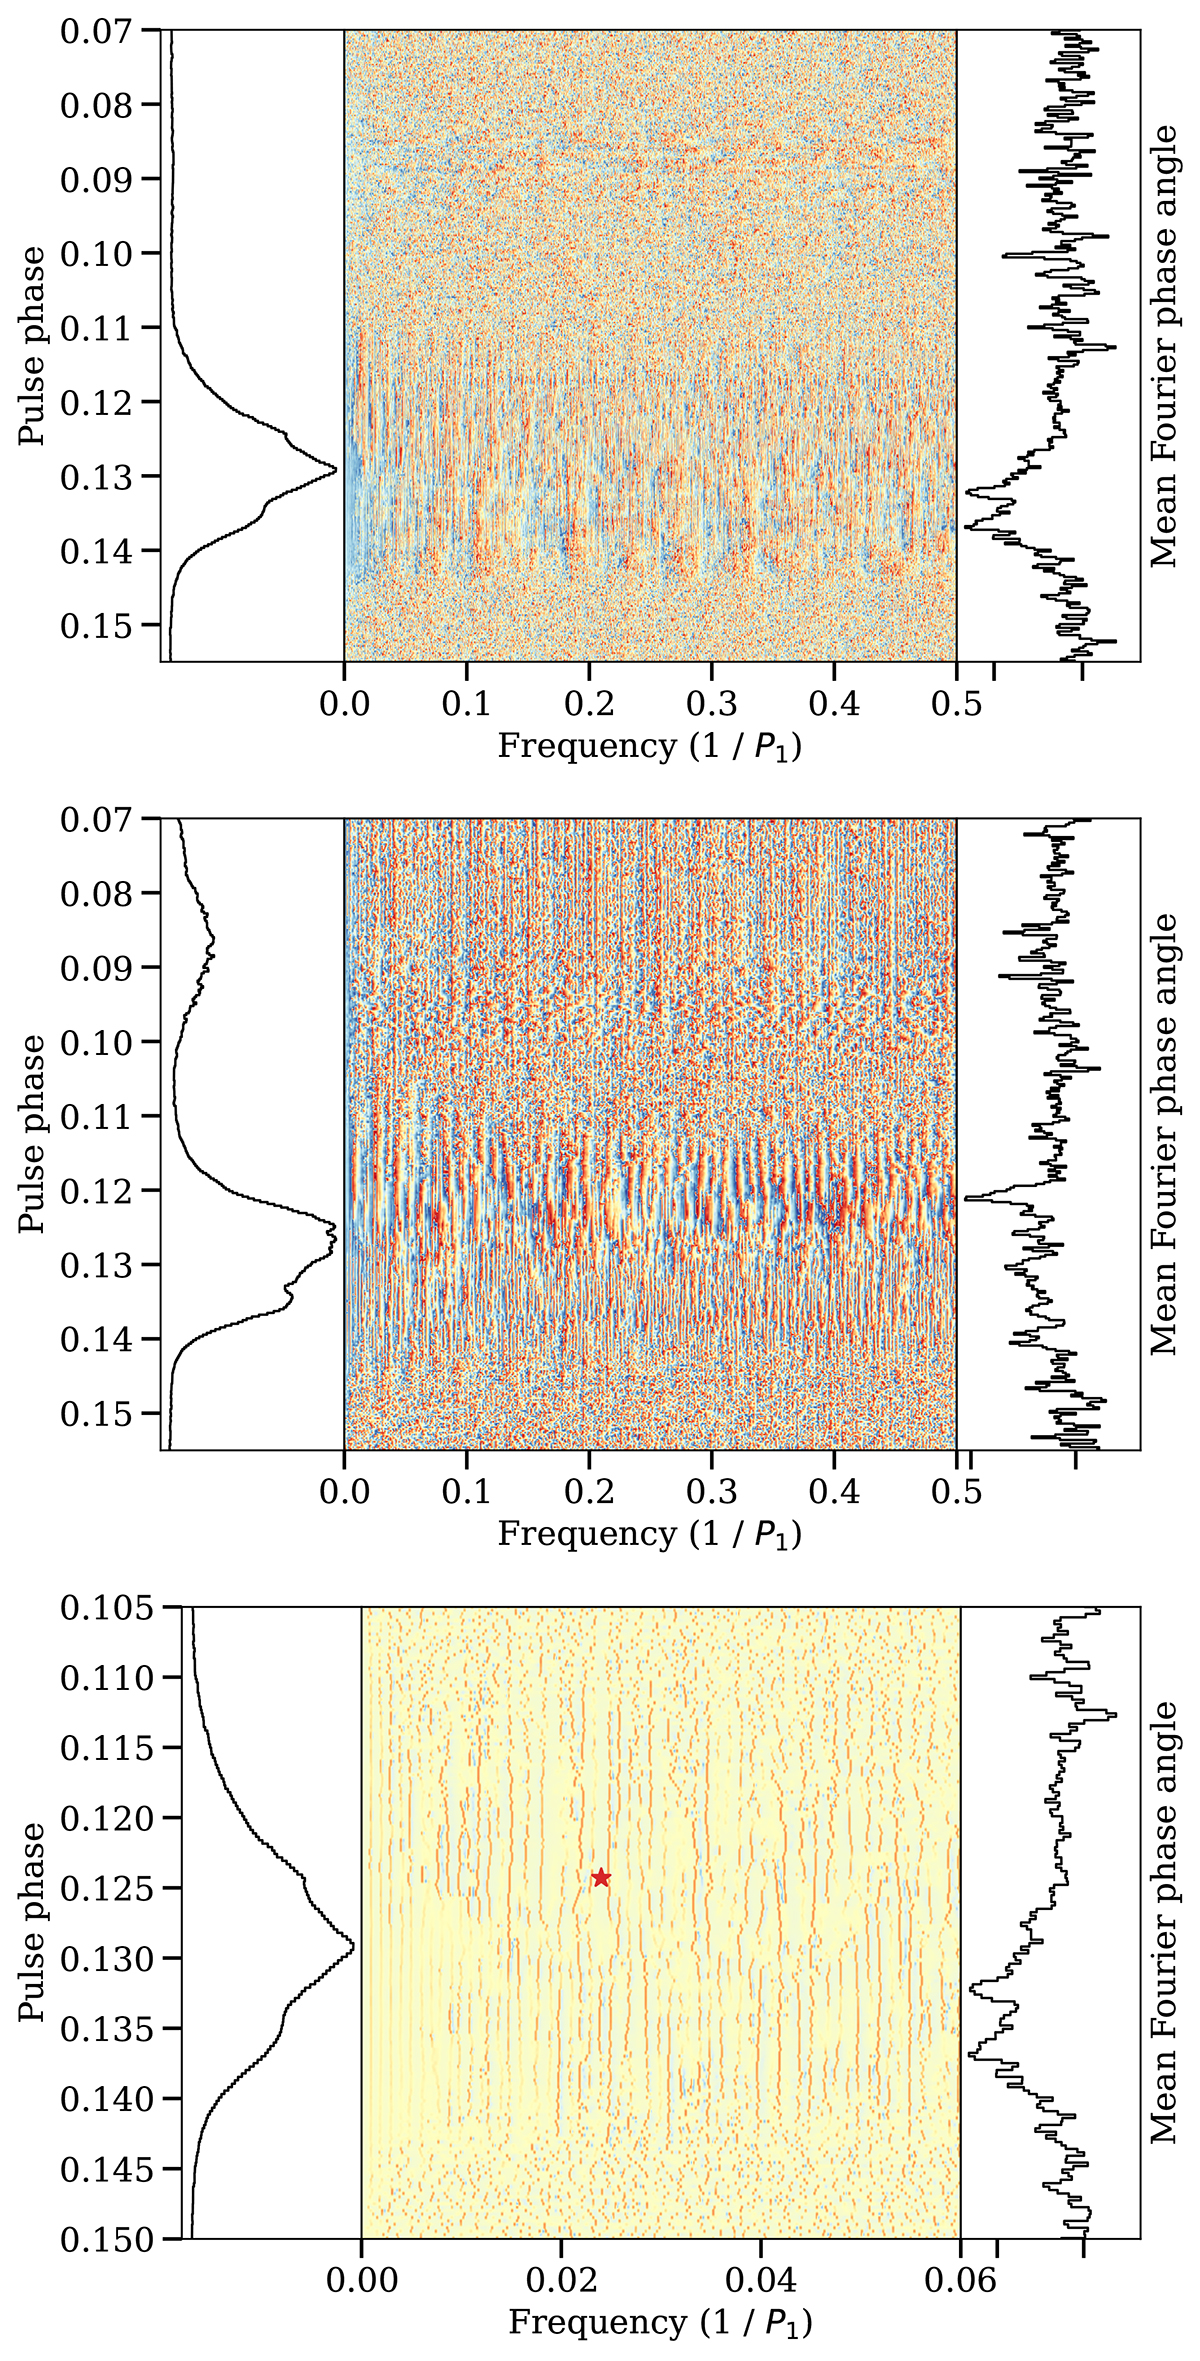
Download original image
Longitude-resolved phase angle spectra of the Q-mode (top) and the B and Bf-mode (middle). The LRPS visualises the phase relationship between different fluctuation frequencies in the pulsar’s emission, in contrast to the LRFS, which shows their magnitudes. The FFT block size was set to 8000 and 1680 rotations, corresponding to eight and four times oversampling. Bottom: phase angle gradient along the frequency axis of the Q-mode LRPS from the top panel. We zoomed into the area near the P3 = 41.7 P1 modulation feature shown with a star marker.
Current usage metrics show cumulative count of Article Views (full-text article views including HTML views, PDF and ePub downloads, according to the available data) and Abstracts Views on Vision4Press platform.
Data correspond to usage on the plateform after 2015. The current usage metrics is available 48-96 hours after online publication and is updated daily on week days.
Initial download of the metrics may take a while.