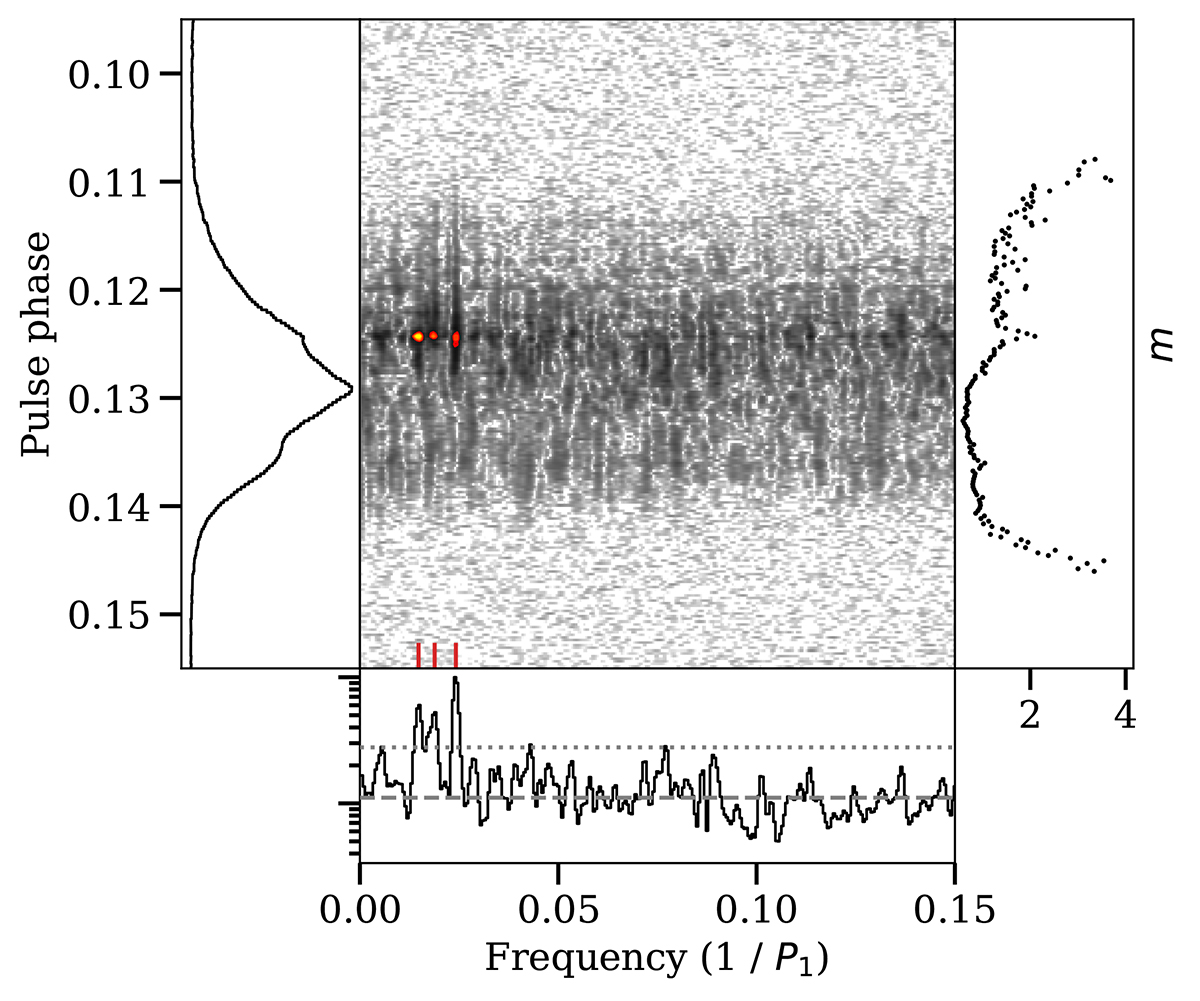
Fig. 12.
Download original image
Longitude-resolved fluctuation spectrum of the pulse stack shown in Fig. 11. The FFT block size was set to 2000 rotations (2× oversampling). The panels show the normalised pulse profile (left), the LRFS (middle), the Fourier-domain modulation index (right), and the summed Fourier power on a logarithmic scale (bottom). The red-orange contours are drawn at 0.5, 0.6, 0.7, 0.8, 0.9, and 0.95 of the maximum fluctuation PSD, and we zoomed into the area around the maximum. The lines in the bottom panel show the mean Fourier power (dashed grey line) and the 5σ power level (dotted grey line). Three significant ≥5σ features are visible that align with the leading hump in the MP’s profile and the local peak in modulation index m. We marked their centroid frequencies with red vertical lines.
Current usage metrics show cumulative count of Article Views (full-text article views including HTML views, PDF and ePub downloads, according to the available data) and Abstracts Views on Vision4Press platform.
Data correspond to usage on the plateform after 2015. The current usage metrics is available 48-96 hours after online publication and is updated daily on week days.
Initial download of the metrics may take a while.