Fig. 11.
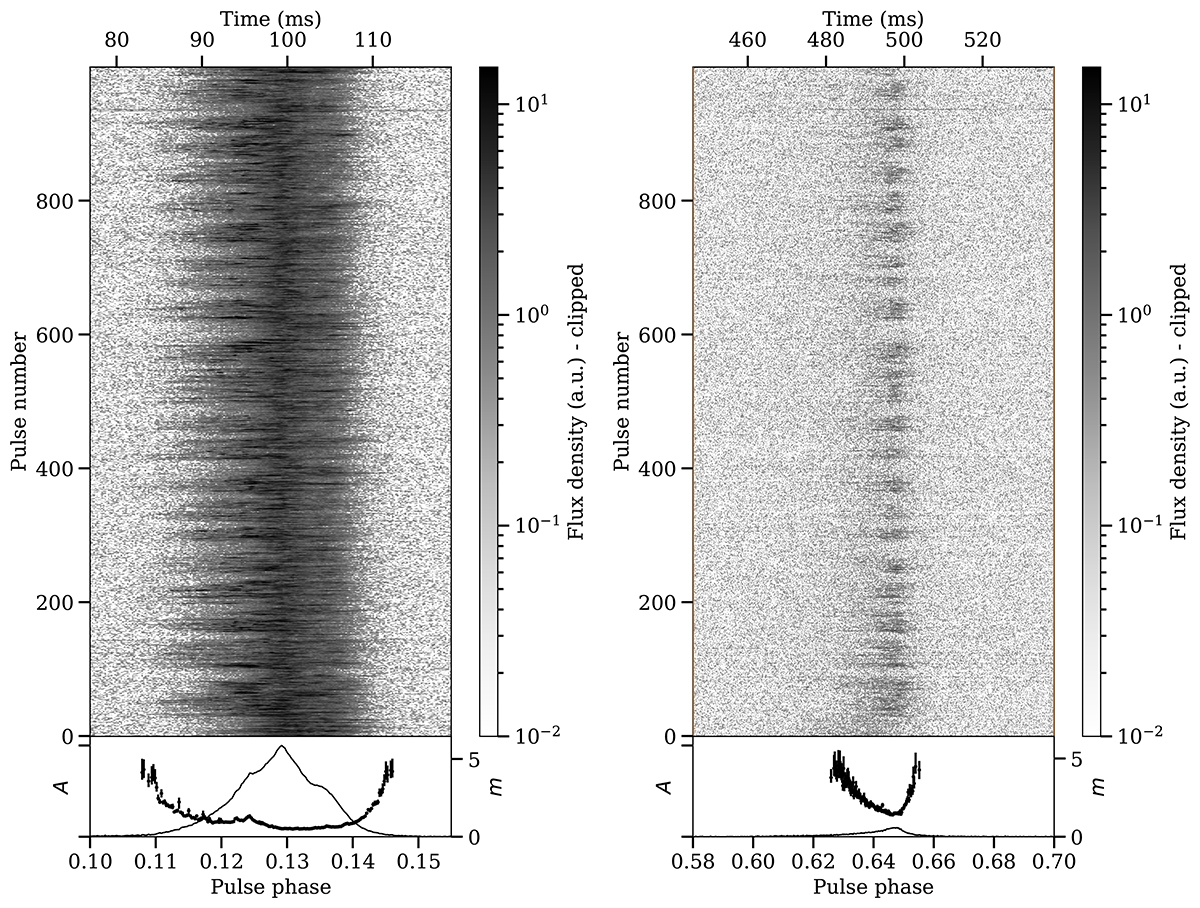
Download original image
Zoomed-in and dynamic range compressed profile stack of 1000 continuous rotations (pulse numbers 150 to 1150) of Q-mode emission taken from the second observation on 2023-04-24, as shown in Fig. 3 right panel. The bottom panels show the same parameters as in Fig. 3. We separately display the MP (left) and IP phase range (right). A longitude-stationary amplitude modulation in the leading profile sub-component of the MP is clearly visible. The IP’s intensity is modulated with the same period and synchronously with the MP’s leading profile component.
Current usage metrics show cumulative count of Article Views (full-text article views including HTML views, PDF and ePub downloads, according to the available data) and Abstracts Views on Vision4Press platform.
Data correspond to usage on the plateform after 2015. The current usage metrics is available 48-96 hours after online publication and is updated daily on week days.
Initial download of the metrics may take a while.