Open Access
Fig. 10.
Download original image
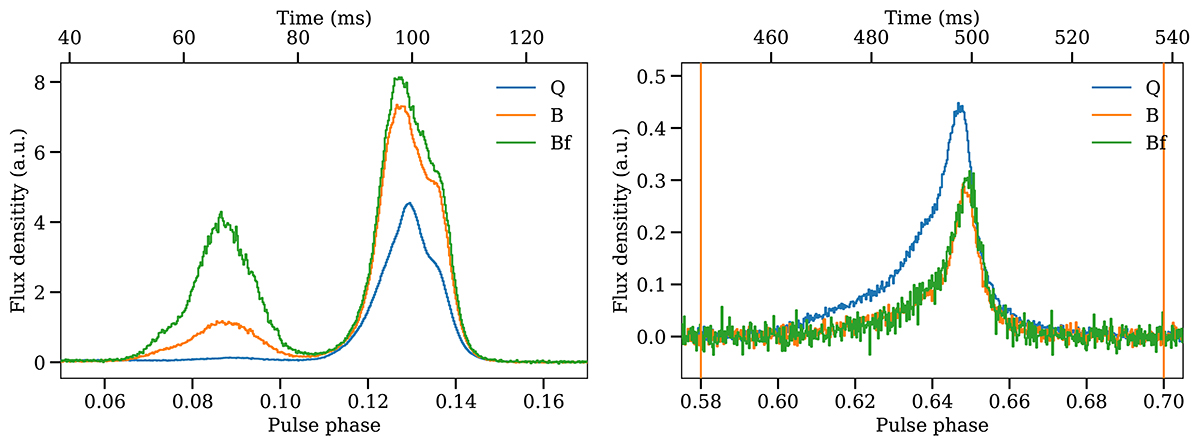
Comparison of the mode-separated mean pulse profiles. The panels show zooms onto the combined PC and MP phase range (left) and the IP phase window (right). The quiescent Q-mode (blue), the bright B-mode (orange), and the bright flaring Bf-mode (green) are plotted on the same absolute scale.
Current usage metrics show cumulative count of Article Views (full-text article views including HTML views, PDF and ePub downloads, according to the available data) and Abstracts Views on Vision4Press platform.
Data correspond to usage on the plateform after 2015. The current usage metrics is available 48-96 hours after online publication and is updated daily on week days.
Initial download of the metrics may take a while.