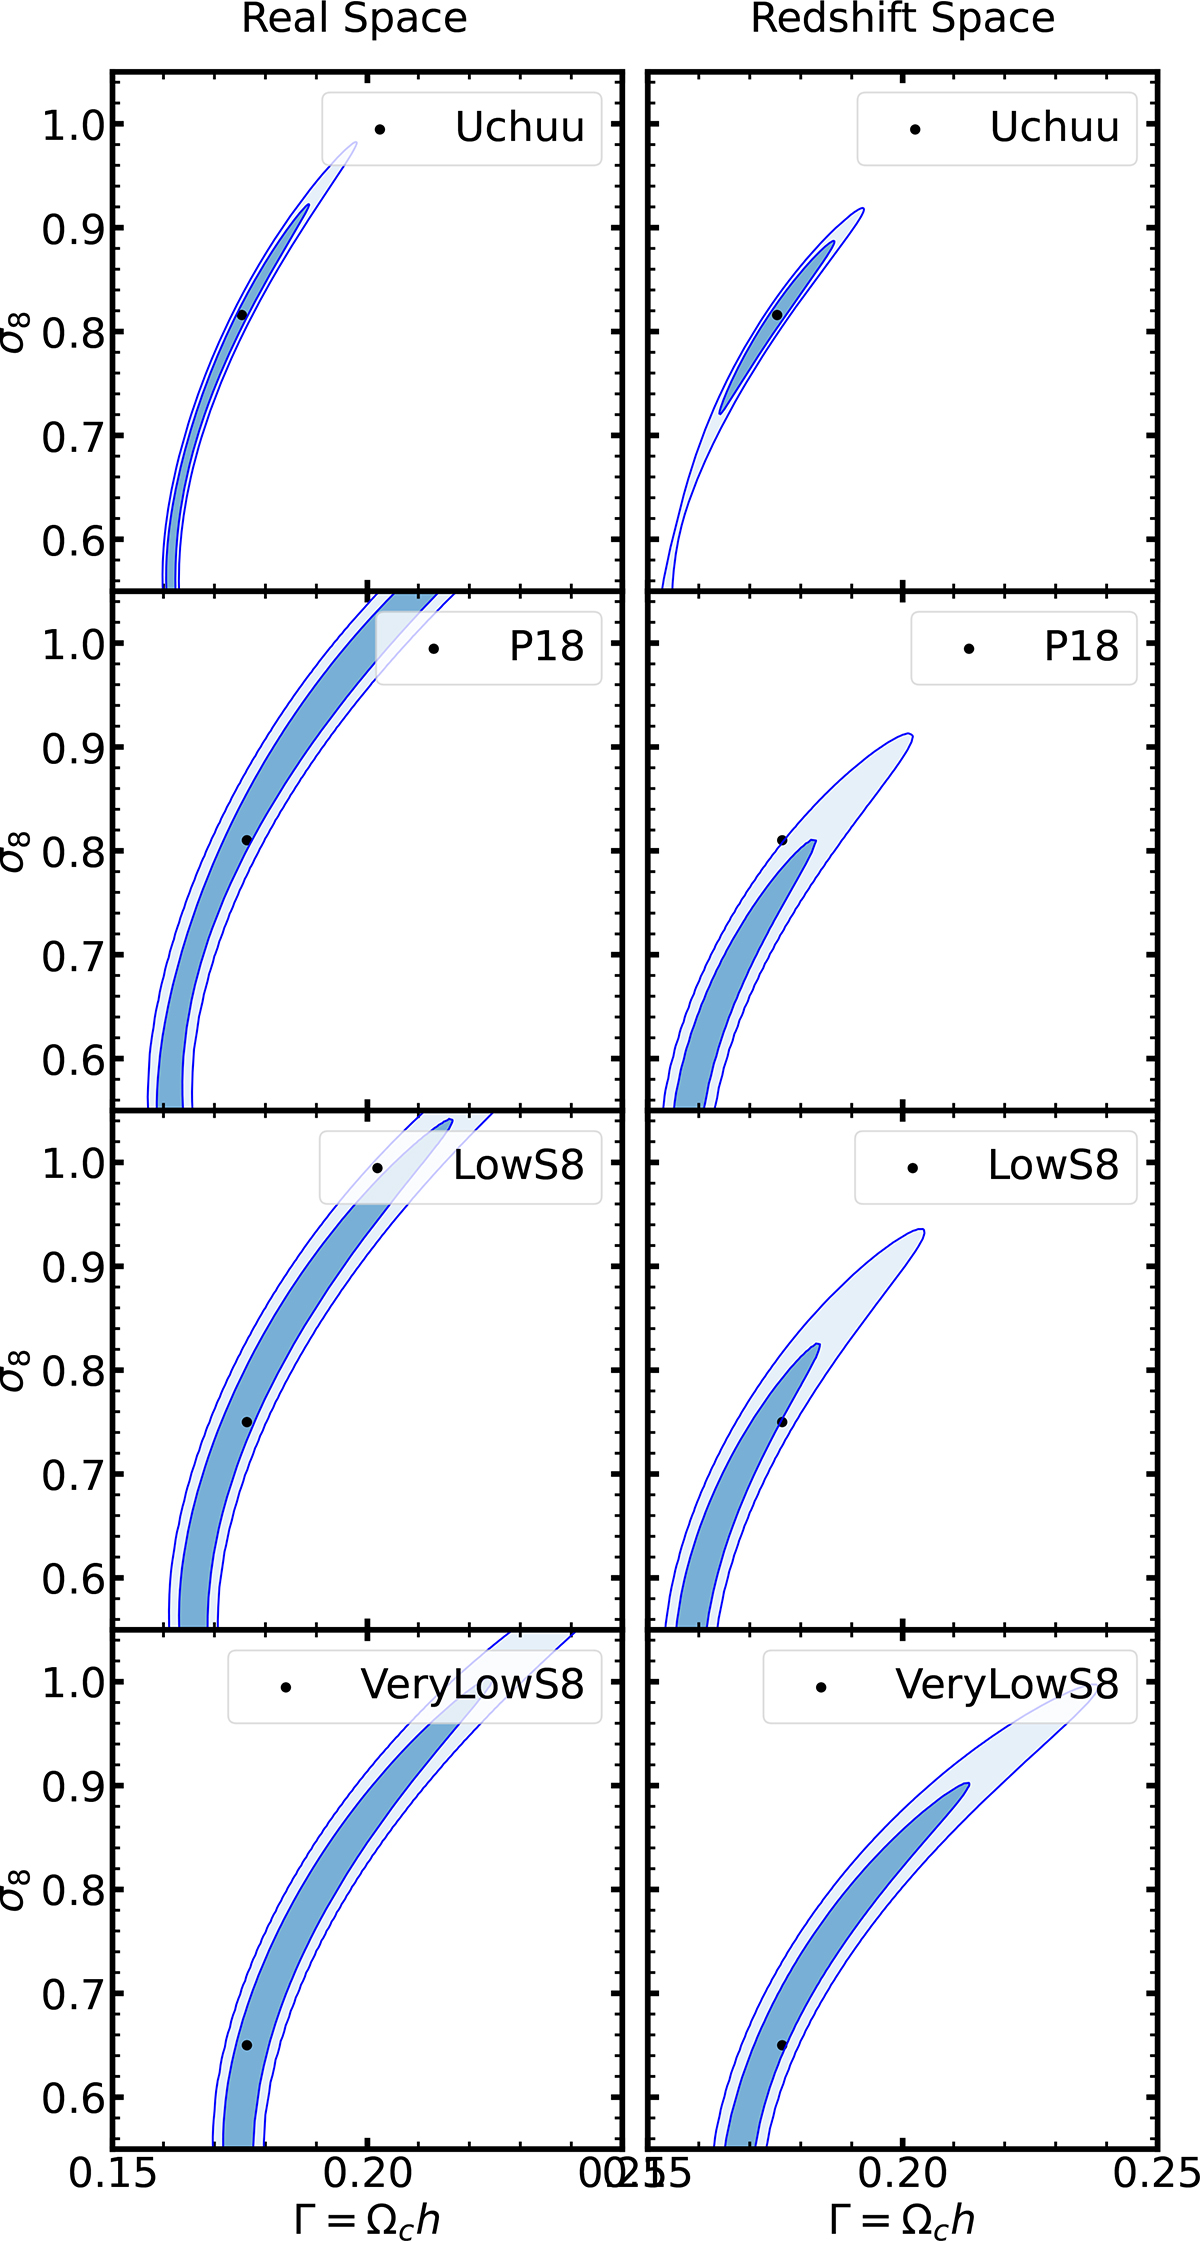
Fig. F.1.
Download original image
Constraints from Nv, i identified in Uchuu (first row), P18 (second row), Low (third row) and VeryLow (row) halo simulation boxes in real (first column) and redshift (second column) spaces using Maximum Likelihood test. The contours indicate the 68% (1σ) and 95% (2σ) credible intervals. The black dots are the real values of σ8 and H0 of each simulation.
Current usage metrics show cumulative count of Article Views (full-text article views including HTML views, PDF and ePub downloads, according to the available data) and Abstracts Views on Vision4Press platform.
Data correspond to usage on the plateform after 2015. The current usage metrics is available 48-96 hours after online publication and is updated daily on week days.
Initial download of the metrics may take a while.