Fig. D.2.
Download original image
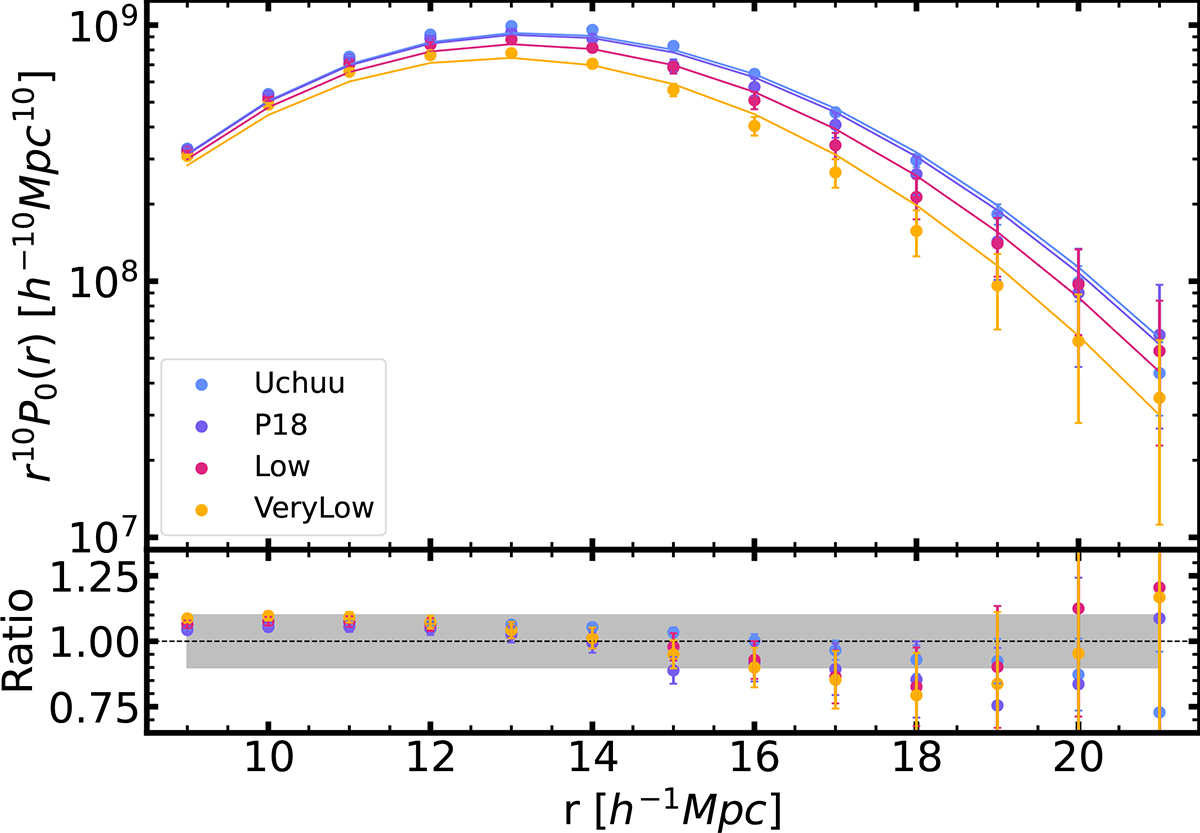
VPF in redshift space is shown for the theoretical framework (lines) and simulations (dots) given in the top panel, while the ratio between simulations and theoretical framework is shown in bottom panels for the Uchuu, P18, Low and VeryLow box catalogues with number density ![]() Mpc−3. Shaded region in bottom panel indicates delimits the region between 0.9 and 1.10 for the ratio.
Mpc−3. Shaded region in bottom panel indicates delimits the region between 0.9 and 1.10 for the ratio.
Current usage metrics show cumulative count of Article Views (full-text article views including HTML views, PDF and ePub downloads, according to the available data) and Abstracts Views on Vision4Press platform.
Data correspond to usage on the plateform after 2015. The current usage metrics is available 48-96 hours after online publication and is updated daily on week days.
Initial download of the metrics may take a while.