Open Access
Fig. 9
Download original image
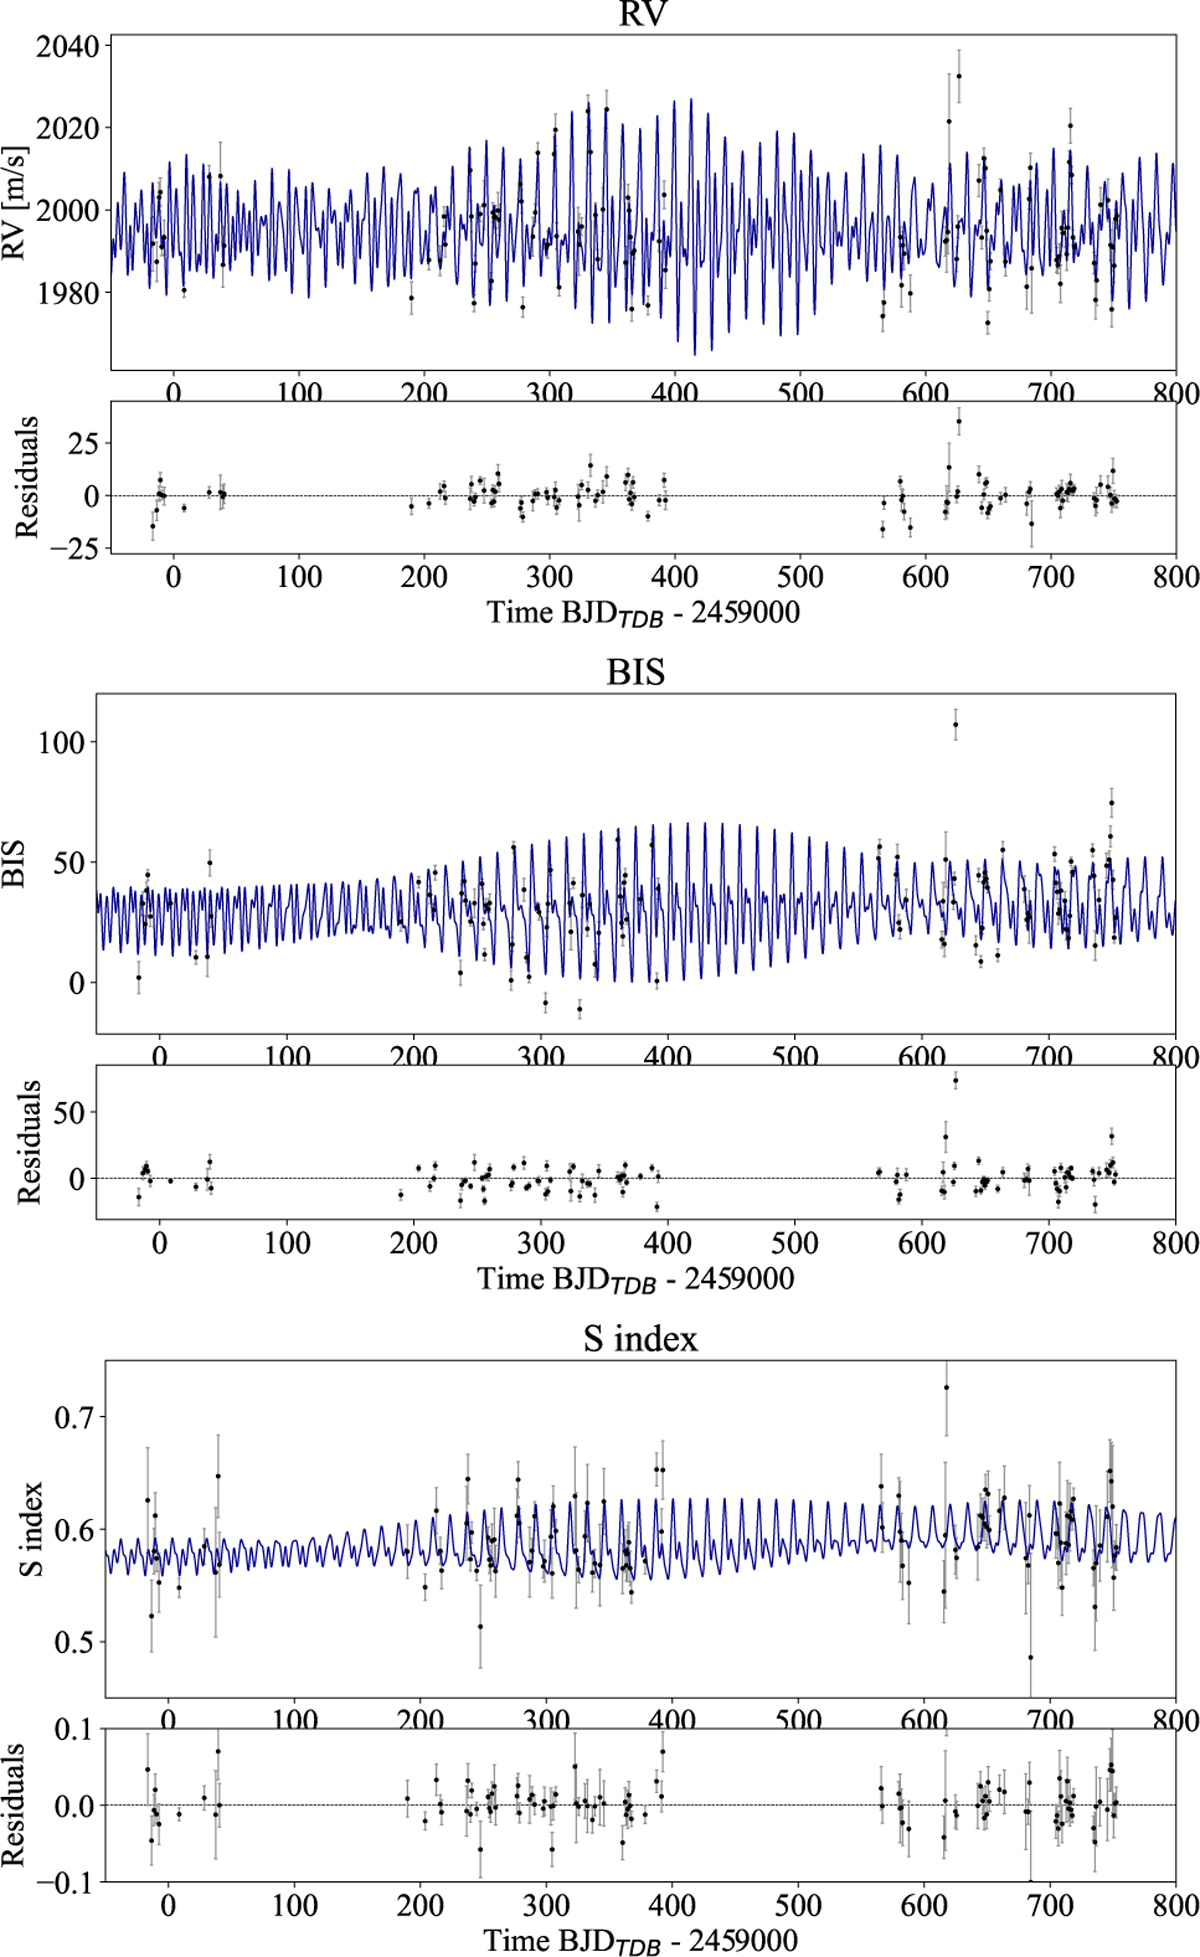
Shown in blue the best-fit model using multidimensional GP. The input vector for the algorithm has been constructed using radial velocity (top panel), bisector (middle panel), and S-index data (bottom panel). For each dataset, the residuals from the models are shown.
Current usage metrics show cumulative count of Article Views (full-text article views including HTML views, PDF and ePub downloads, according to the available data) and Abstracts Views on Vision4Press platform.
Data correspond to usage on the plateform after 2015. The current usage metrics is available 48-96 hours after online publication and is updated daily on week days.
Initial download of the metrics may take a while.