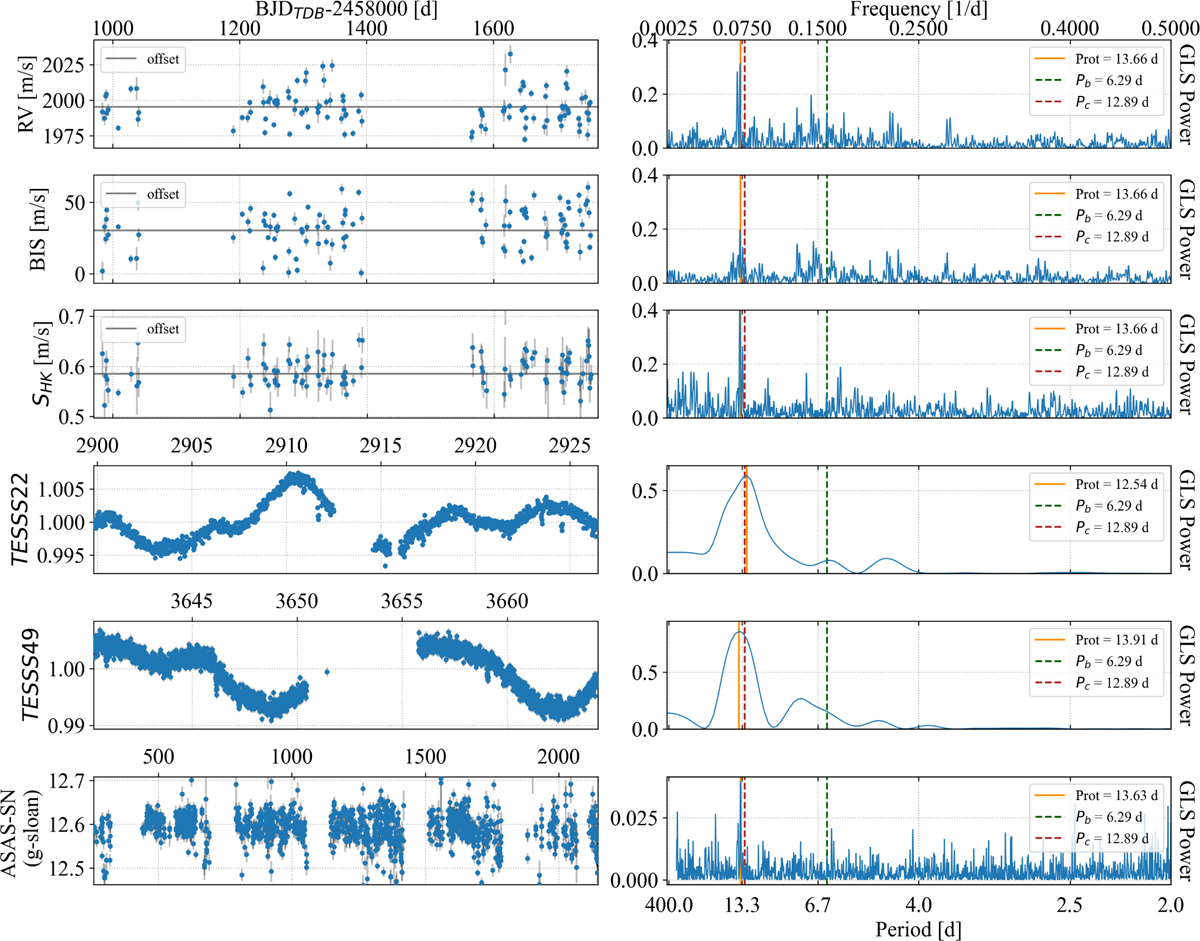
Fig. 3
Download original image
Generalized Lomb–Scargle periodograms. In order from the top to the bottom panel: HARPS-N spectrograph RVs, BIS, and SHK series; TESS photometric time series (Sectors 22 and 49); and ASAS-SN. The vertical orange lines represent the main peak of the periodogram, at ~I3.4 days, corresponding to the stellar rotation period Prot. The green and the red lines represent the orbital period of, respectively, planets b and -c.
Current usage metrics show cumulative count of Article Views (full-text article views including HTML views, PDF and ePub downloads, according to the available data) and Abstracts Views on Vision4Press platform.
Data correspond to usage on the plateform after 2015. The current usage metrics is available 48-96 hours after online publication and is updated daily on week days.
Initial download of the metrics may take a while.