Open Access
Fig. 21
Download original image
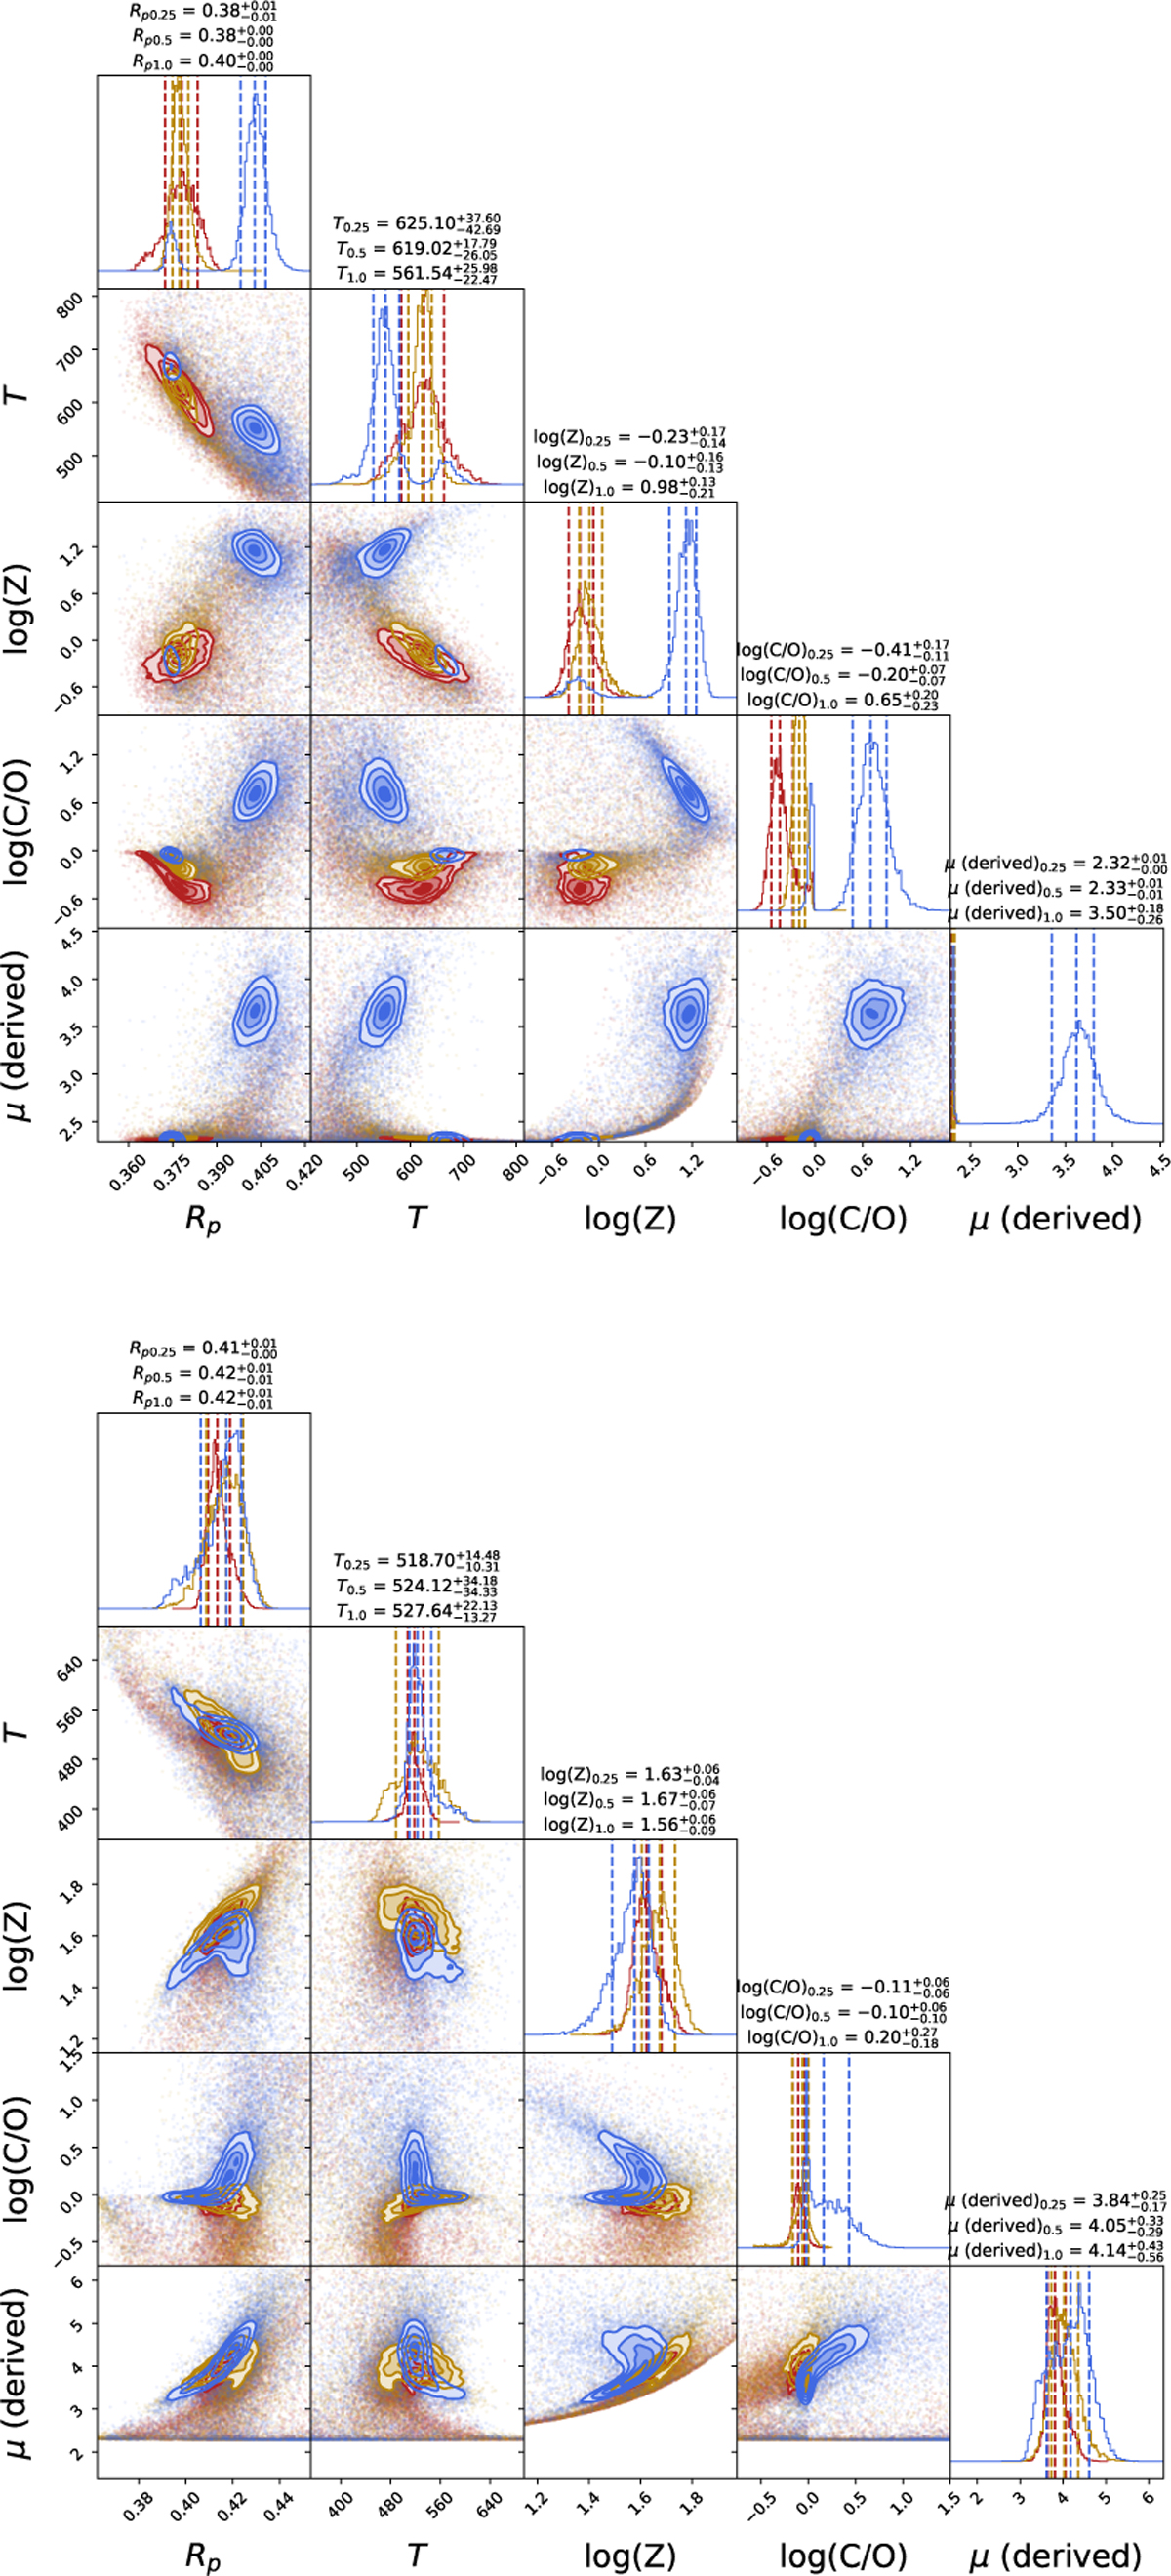
Posterior distributions for the three different C/O assumptions. In red, C/O = 0.25; in yellow, C/O = 0.5; and in blue, C/O = 1.0. In the top panel, the posterior distributions for the primary atmosphere scenario are displayed, while in the bottom panel are the ones for the secondary atmosphere scenario.
Current usage metrics show cumulative count of Article Views (full-text article views including HTML views, PDF and ePub downloads, according to the available data) and Abstracts Views on Vision4Press platform.
Data correspond to usage on the plateform after 2015. The current usage metrics is available 48-96 hours after online publication and is updated daily on week days.
Initial download of the metrics may take a while.