Open Access
Fig. 19
Download original image
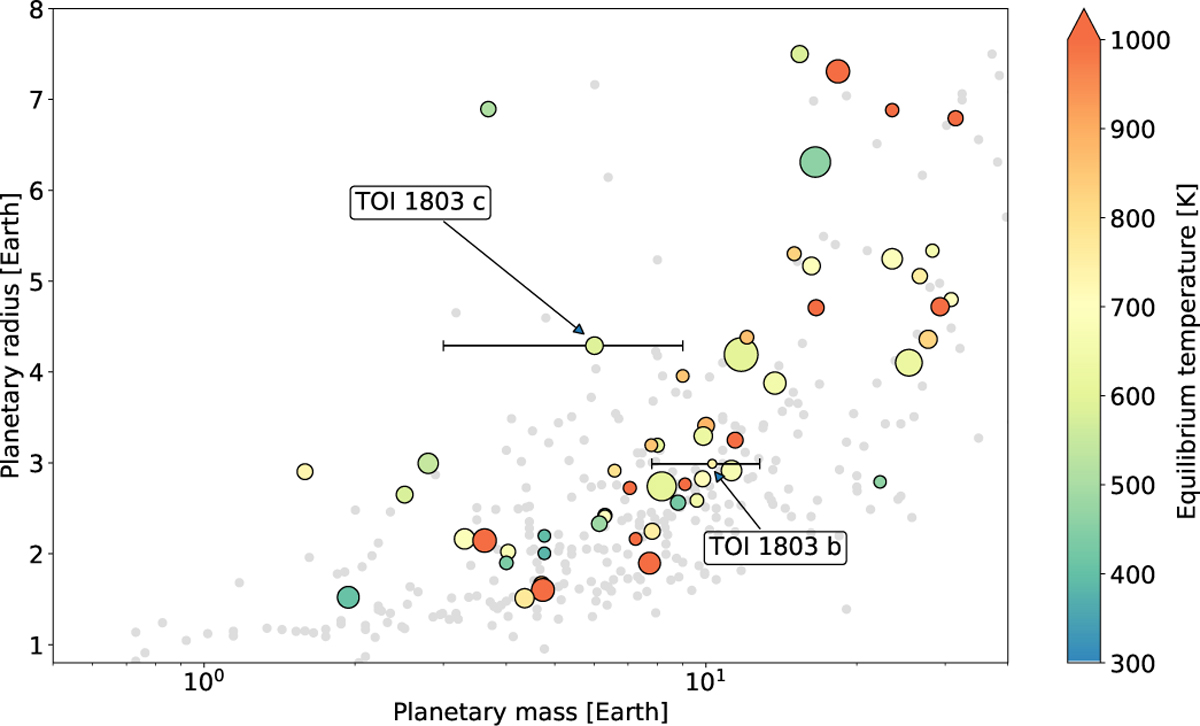
Mass-radius diagram with all the planetary candidates with M < 30 M⊕ and R < 8 R⊕ in the TEPCat catalog (Southworth 2011). The color bar represents the equilibrium temperature of the planet when the object has TSM > 80, while the others are colored in gray.
Current usage metrics show cumulative count of Article Views (full-text article views including HTML views, PDF and ePub downloads, according to the available data) and Abstracts Views on Vision4Press platform.
Data correspond to usage on the plateform after 2015. The current usage metrics is available 48-96 hours after online publication and is updated daily on week days.
Initial download of the metrics may take a while.