Open Access
Fig. 11
Download original image
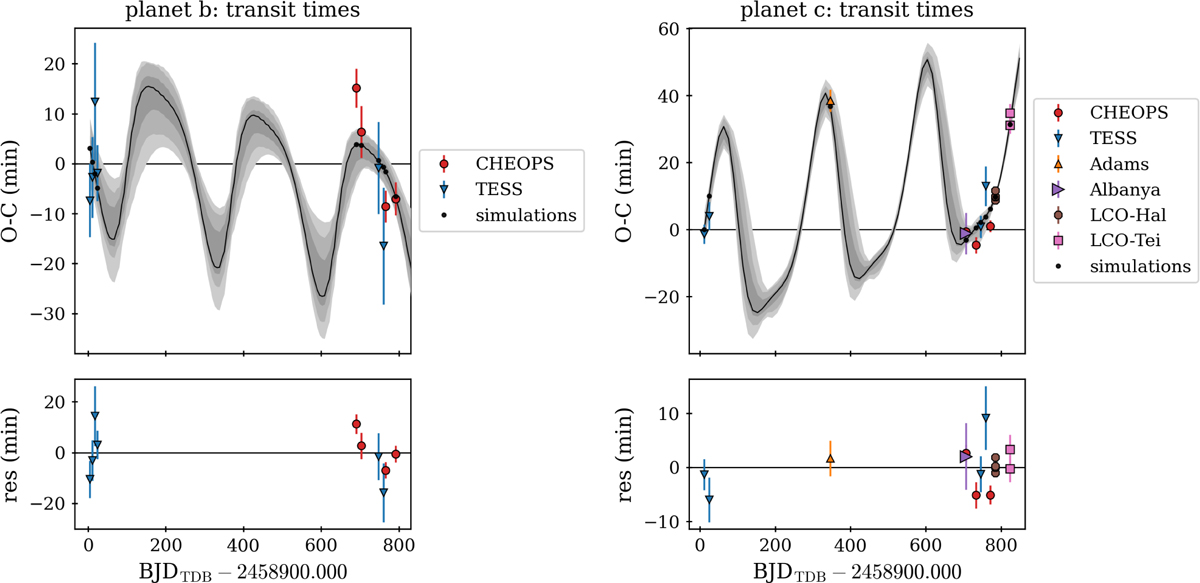
O-C diagram for the planets b (left) and c (right) comparing the observations (different marker and color) with TRADES simulations (black circles). The black line is the oversampled best-fit model, and the gray shaded areas are the one, two, and three σ computed from 100 samples drawn from the posterior distribution.
Current usage metrics show cumulative count of Article Views (full-text article views including HTML views, PDF and ePub downloads, according to the available data) and Abstracts Views on Vision4Press platform.
Data correspond to usage on the plateform after 2015. The current usage metrics is available 48-96 hours after online publication and is updated daily on week days.
Initial download of the metrics may take a while.