Fig. 5
Download original image
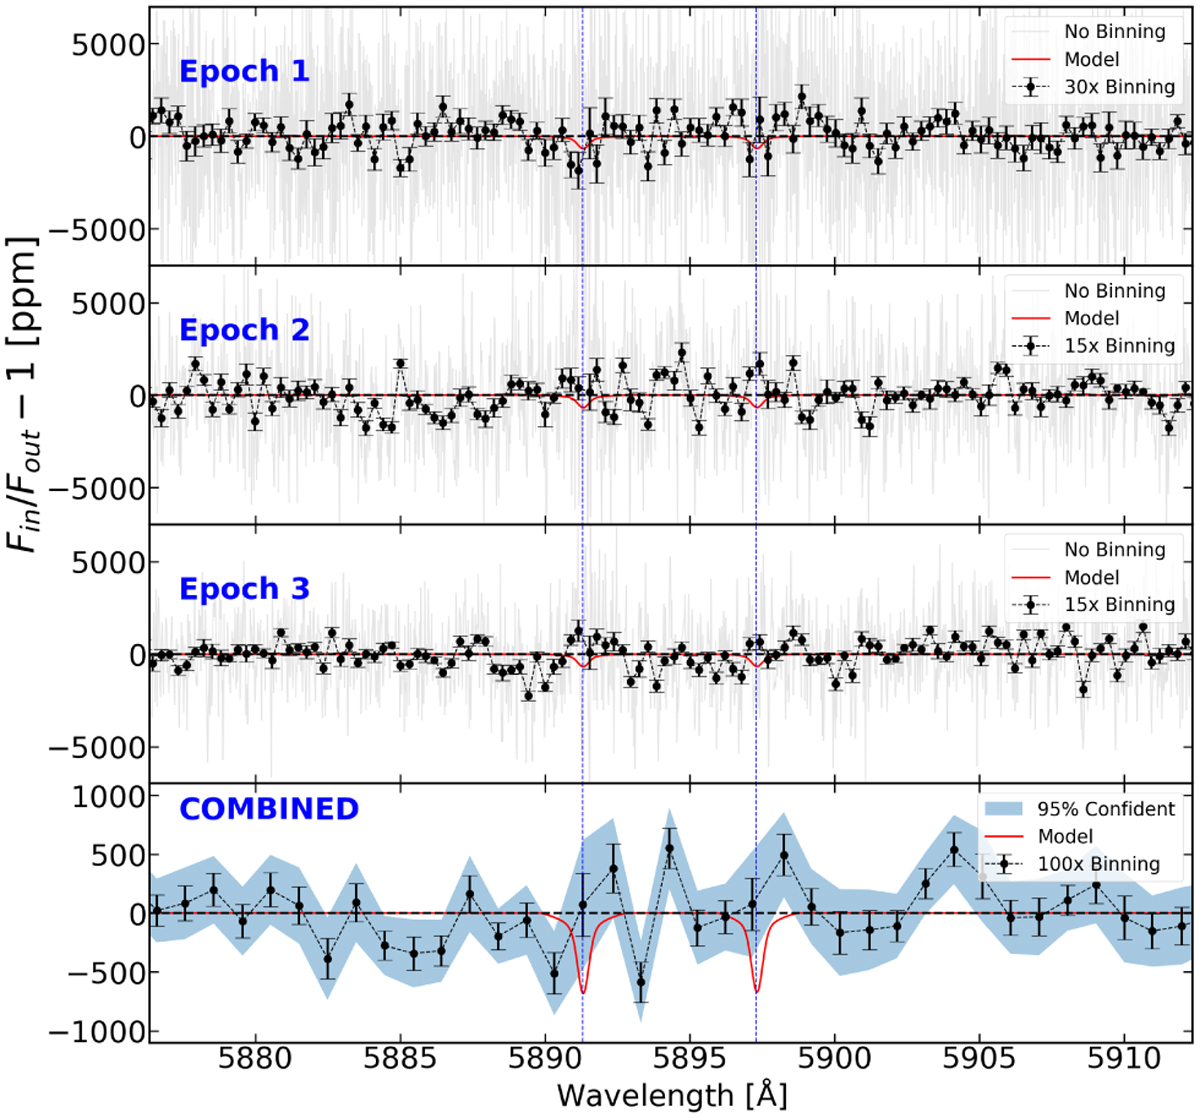
Transmission spectra around the sodium doublet for the three epochs. The three upper panels are the transmission spectrum of each individual epoch. Grey lines are the transmission spectrum. Black dots are the data binned by a factor of 30 and 15, for the upper and middle two panels respectively, error bars are calculated as the standard deviation of the data inside the bins, and red lines are the predicted signal of the petitRADTRANS model. The bottom panel shows the combined data at a different binning. The light blue area shows the 95% confidence region assuming a Student’s t-distribution. Vertical blue lines indicate the core of the sodium doublet in reference to the host star.
Current usage metrics show cumulative count of Article Views (full-text article views including HTML views, PDF and ePub downloads, according to the available data) and Abstracts Views on Vision4Press platform.
Data correspond to usage on the plateform after 2015. The current usage metrics is available 48-96 hours after online publication and is updated daily on week days.
Initial download of the metrics may take a while.