Fig. 2
Download original image
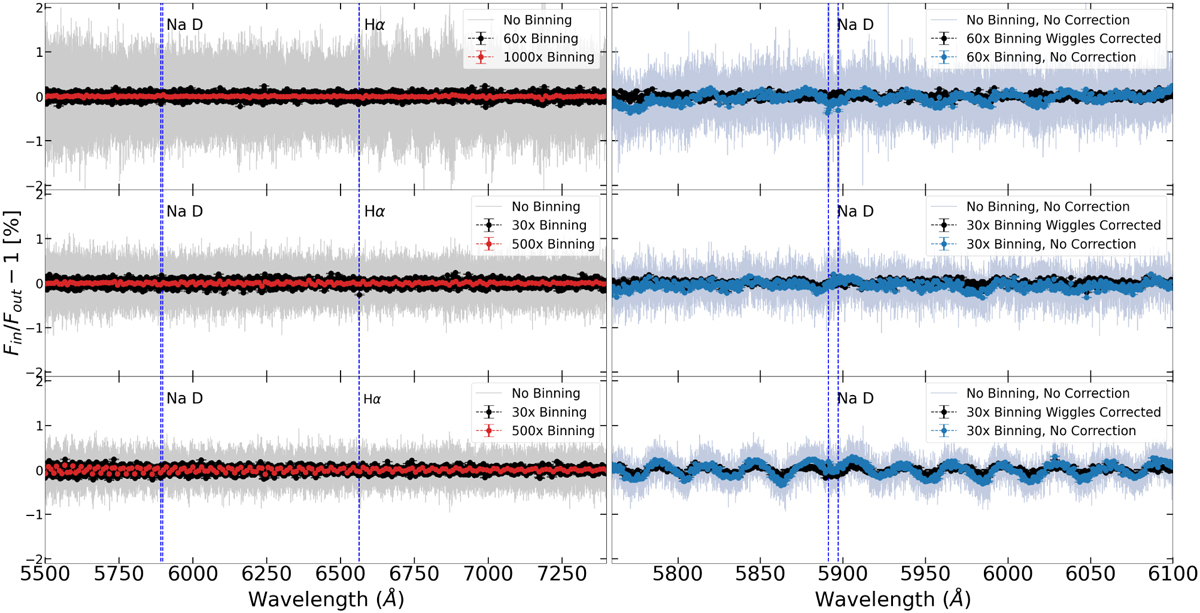
Wiggle-corrected transmission spectra of LTT 9779b across the full wavelength range. The panels present transmission spectra from three epochs, obtained with the red arm of ESPRESSO. The grey line shows the raw data, the black lines represent the same data binned by a factor of 30, and the orange dots correspond to binning by a factor of 500. The sodium doublet and Hα features are marked by blue vertical lines for reference. The top panel displays the 2019 data, while the middle and bottom panels correspond to the 2021 observations. The right panels follow a similar format, comparing spectra with and without the low-frequency wiggle correction.
Current usage metrics show cumulative count of Article Views (full-text article views including HTML views, PDF and ePub downloads, according to the available data) and Abstracts Views on Vision4Press platform.
Data correspond to usage on the plateform after 2015. The current usage metrics is available 48-96 hours after online publication and is updated daily on week days.
Initial download of the metrics may take a while.