Fig. 11
Download original image
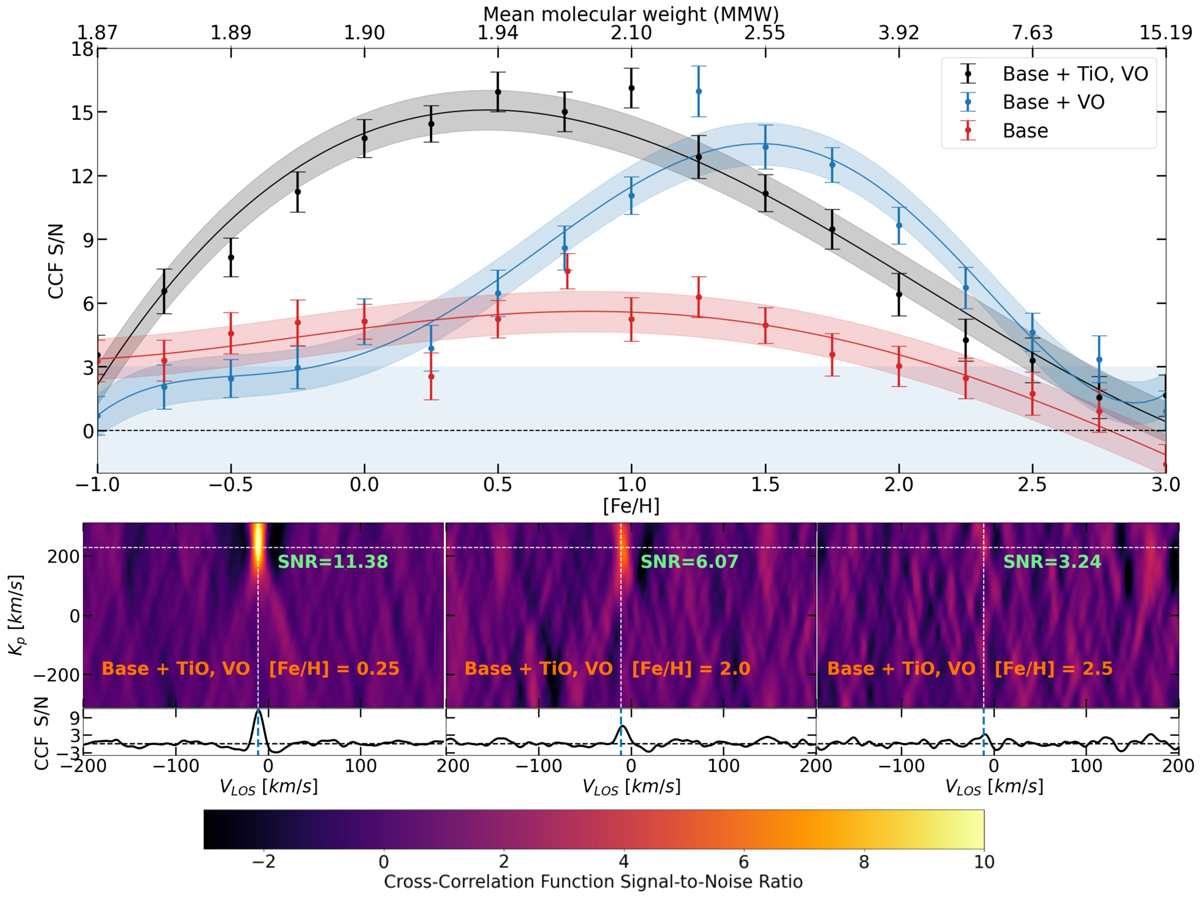
Comparison of the cross-correlation signal-to-noise ratio (S/N) for atmospheres with varying compositions and metallicities. Top: CCF in terms of S/N for different abundances or the equivalent Mean molecular weight. It compares three different injected models with the presence or absence of TiO and VO. The bottom plots give CCF examples for comparison of the planet’s Keplerian velocity vs the line-of-sight velocity map. It shows different levels of significance for different abundances. Below them is a plot of a row in the injected planet velocity from the CCF velocity map.
Current usage metrics show cumulative count of Article Views (full-text article views including HTML views, PDF and ePub downloads, according to the available data) and Abstracts Views on Vision4Press platform.
Data correspond to usage on the plateform after 2015. The current usage metrics is available 48-96 hours after online publication and is updated daily on week days.
Initial download of the metrics may take a while.