Fig. 10
Download original image
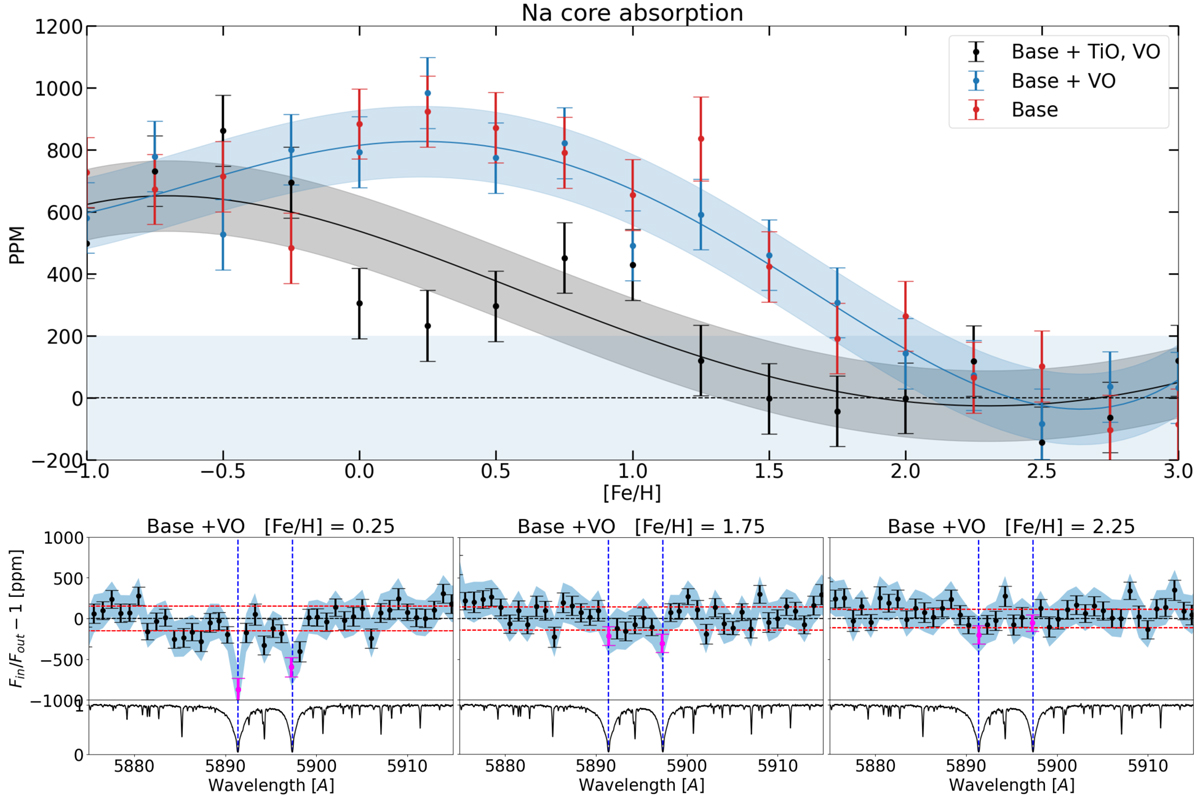
Top: Transmission Spectroscopy showing extra absorption in the Na doublet’s core lines across different global abundances, measured in PPM. This plot compares three injected models, illustrating the presence or absence of TiO and VO. It features one example with error bars plus a main strand after several runs. In light blue, regions below 200 ppm are highlighted, indicating areas under the estimated error threshold coming from models without signals. Bottom: Three examples of Transmission Spectroscopy in PPM are presented. Black points represent data binned by a factor of 100, the light blue area denotes a 95% confidence interval, magenta highlights the core lines, and red dashed lines indicate the standard deviation of the continuum. Below these plots are normalised flux profiles centred on the core lines, with a dashed blue line marking the Na doublets.
Current usage metrics show cumulative count of Article Views (full-text article views including HTML views, PDF and ePub downloads, according to the available data) and Abstracts Views on Vision4Press platform.
Data correspond to usage on the plateform after 2015. The current usage metrics is available 48-96 hours after online publication and is updated daily on week days.
Initial download of the metrics may take a while.