Fig. 1
Download original image
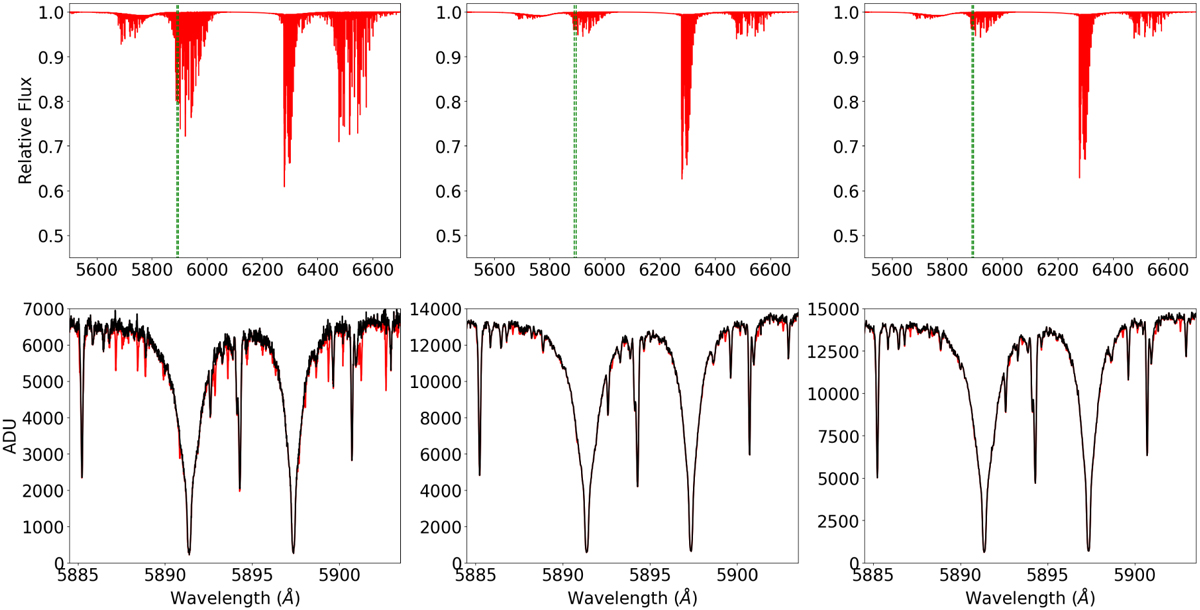
Example of the telluric correction of one exposure taken on each of the three nights. The red lines in the top panels are the Earth’s transmission model from Molecfit for those exposures. In the lower panels, the red curves are the uncorrected spectra, whereas the black curves are the corrected spectra. The panels from left to right correspond to nights 1, 2, and 3, respectively.
Current usage metrics show cumulative count of Article Views (full-text article views including HTML views, PDF and ePub downloads, according to the available data) and Abstracts Views on Vision4Press platform.
Data correspond to usage on the plateform after 2015. The current usage metrics is available 48-96 hours after online publication and is updated daily on week days.
Initial download of the metrics may take a while.