Fig. 9
Download original image
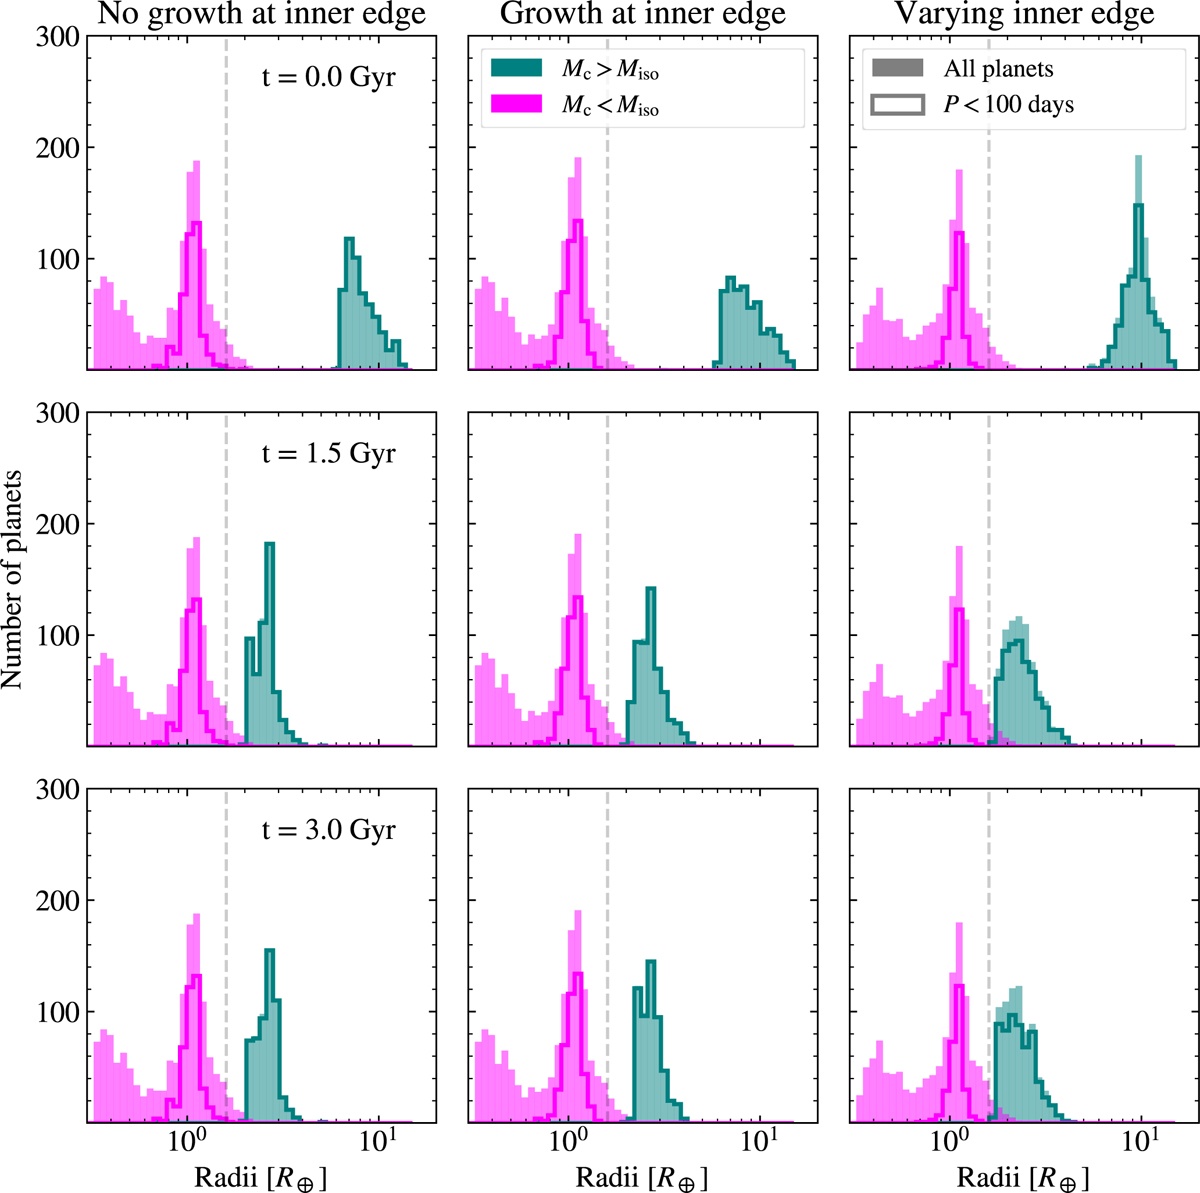
Histogram of the resulting planet radii for the three growth models at three different snapshots in time after disc dissipation. The filled histograms show the entire planet population while the unfilled histograms show planets with P < 100 days. Clearly, the radius gap at ~1.6 R⊕ (denoted by a dashed line) can exist without the need for mass loss. When the inner edge is at 0.1 AU, the outer peak is at ~2.4–2.6 R⊕, in agreement with observations. However, when the inner edge varies between 0.1 AU and ~1 AU, the radii of a large number of planets with atmospheres are significantly larger (3–4 R⊕) as they are more massive and therefore contract slower.
Current usage metrics show cumulative count of Article Views (full-text article views including HTML views, PDF and ePub downloads, according to the available data) and Abstracts Views on Vision4Press platform.
Data correspond to usage on the plateform after 2015. The current usage metrics is available 48-96 hours after online publication and is updated daily on week days.
Initial download of the metrics may take a while.