Fig. 7
Download original image
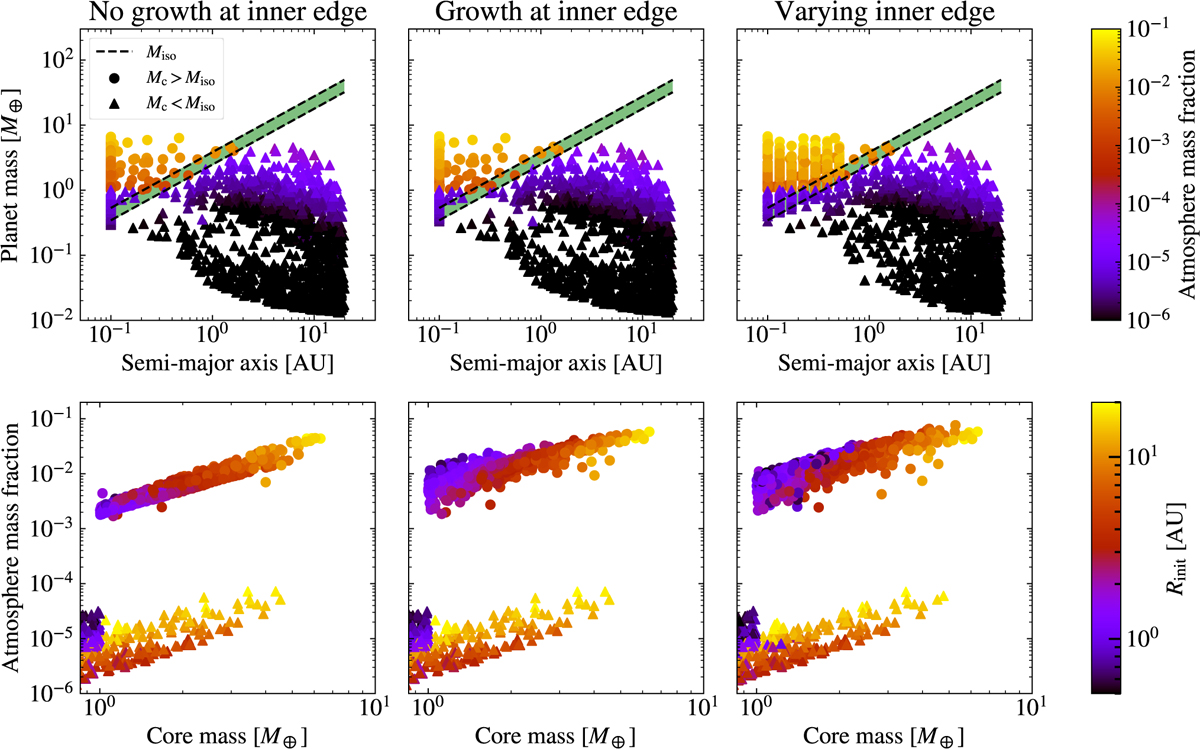
Top row: final semi-major axes and planet masses for the planet population after disc dissipation. The color denotes the final atmosphere mass fraction. The dashed lines show the pebble isolation mass at the start and end of the disc lifetime; the variation is due to the temporal change of the stellar luminosity. Bottom row: atmosphere mass fraction as a function of core masses. The colors of the points show the injection location in the disc. In the left column we show the population when gas accretion at the inner edge is halted. In the middle column we show the population when gas accretion continues at the inner edge while in the right column we show the planet population when we vary the inner edge. In general, atmosphere mass fractions for massive cores are similar in all three models. If gas accretion is halted at the inner edge, atmosphere mass fractions are low (up to ~0.1–5%) due to the efficient migration happening in the disc. When gas accretion continues at the inner edge, the atmosphere mass fractions of the smallest cores can reach up to 1%. Finally, when varying the inner edge, planets that are accreting gas farther away from the star are able to accrete more gas due to more efficient contraction, reaching atmosphere mass fractions of almost ~10%.
Current usage metrics show cumulative count of Article Views (full-text article views including HTML views, PDF and ePub downloads, according to the available data) and Abstracts Views on Vision4Press platform.
Data correspond to usage on the plateform after 2015. The current usage metrics is available 48-96 hours after online publication and is updated daily on week days.
Initial download of the metrics may take a while.