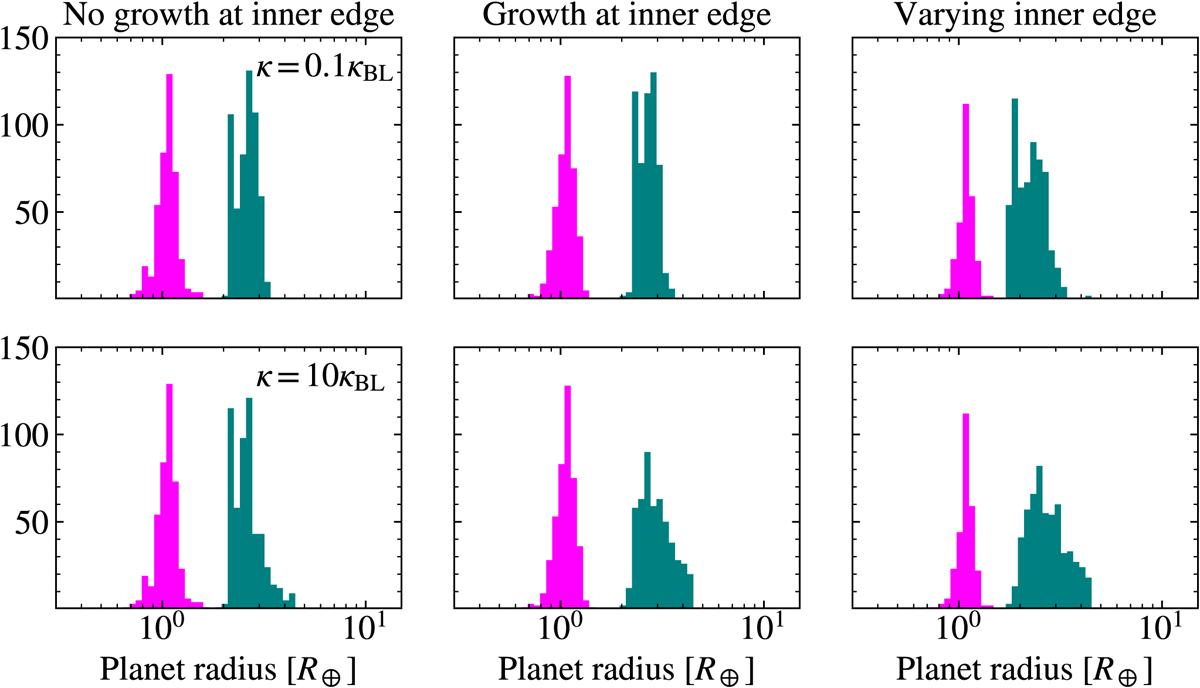
Fig. G.1
Download original image
Resulting radius distribution for all of our models for two different opacities after 3 Gyr evolution. The top row shows the resulting distribution after contraction with κ = 0.1κBL while the bottom row shows the resulting distribution with κ = 10κBL. Decreasing the opacity with a factor of 0.1 does not affect the final distribution significantly as contraction is already efficient in our nominal case. In contrast, increasing the opacity significantly slows down contraction such that a significant fraction of planets remain large at ~3–4 R⊕.
Current usage metrics show cumulative count of Article Views (full-text article views including HTML views, PDF and ePub downloads, according to the available data) and Abstracts Views on Vision4Press platform.
Data correspond to usage on the plateform after 2015. The current usage metrics is available 48-96 hours after online publication and is updated daily on week days.
Initial download of the metrics may take a while.