Fig. A.2
Download original image
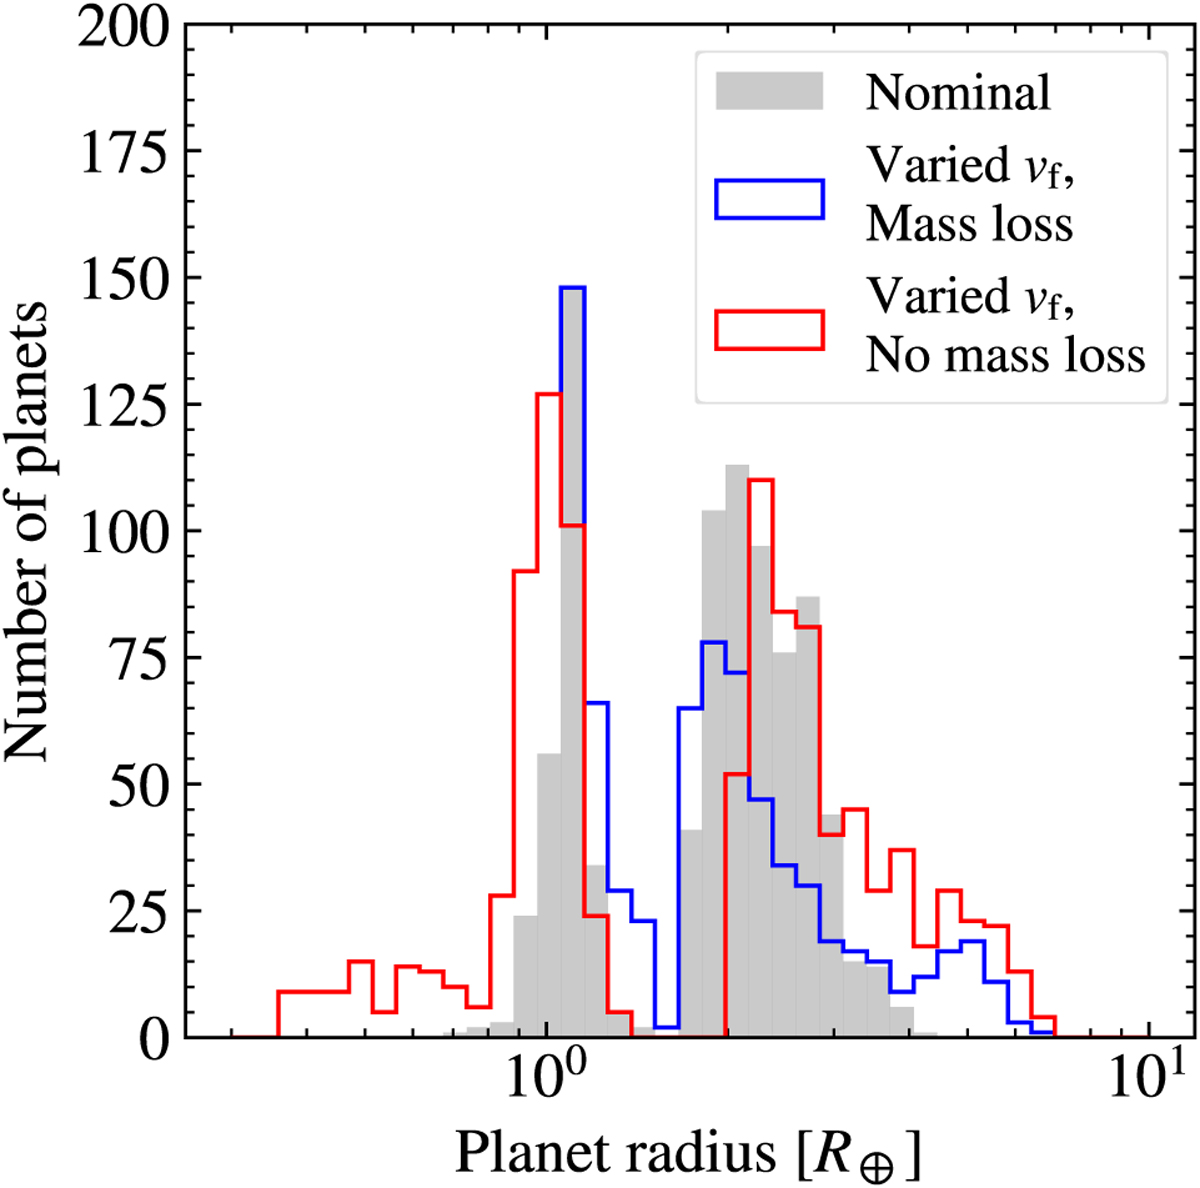
Radius distribution after 3 Gyr of evolution with a varying fragmentation velocity inside and outside the water ice line. The grey histogram shows the distribution using our nominal model without any mass loss while the blue histogram shows the same distribution but with photo-evaporative mass loss as described in Appendix F. We only consider our migration model where we vary the inner edge of the planets. Clearly, even when including more massive cores, we are able to reproduce the general location of the radius gap both with and without photo-evaporative mass loss.
Current usage metrics show cumulative count of Article Views (full-text article views including HTML views, PDF and ePub downloads, according to the available data) and Abstracts Views on Vision4Press platform.
Data correspond to usage on the plateform after 2015. The current usage metrics is available 48-96 hours after online publication and is updated daily on week days.
Initial download of the metrics may take a while.