Fig. 11
Download original image
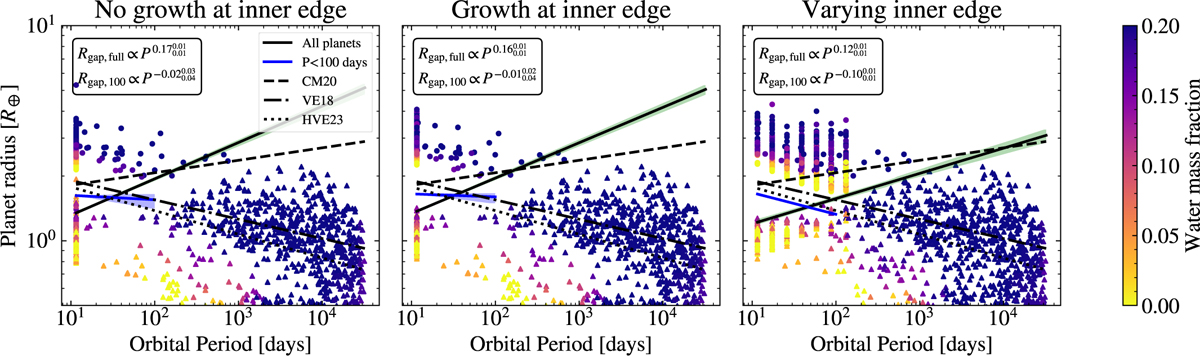
Planet radius as a function of orbital period for the three different models. Circles show planets above pebble isolation mass while triangles show planets below pebble isolation mass. The color of the points show the mass fraction of water. The solid lines show the fitted gaps in this work, both for the full population (black) and when limiting the population to only planets with orbital periods less than 100 days (blue). We also show the slopes from previous work by Cloutier & Menou (2020, CM20), Van Eylen et al. (2018, VE18), and Ho & Van Eylen (2023, HVE23). We also show the values for the fitted slopes.
Current usage metrics show cumulative count of Article Views (full-text article views including HTML views, PDF and ePub downloads, according to the available data) and Abstracts Views on Vision4Press platform.
Data correspond to usage on the plateform after 2015. The current usage metrics is available 48-96 hours after online publication and is updated daily on week days.
Initial download of the metrics may take a while.