Fig. 1
Download original image
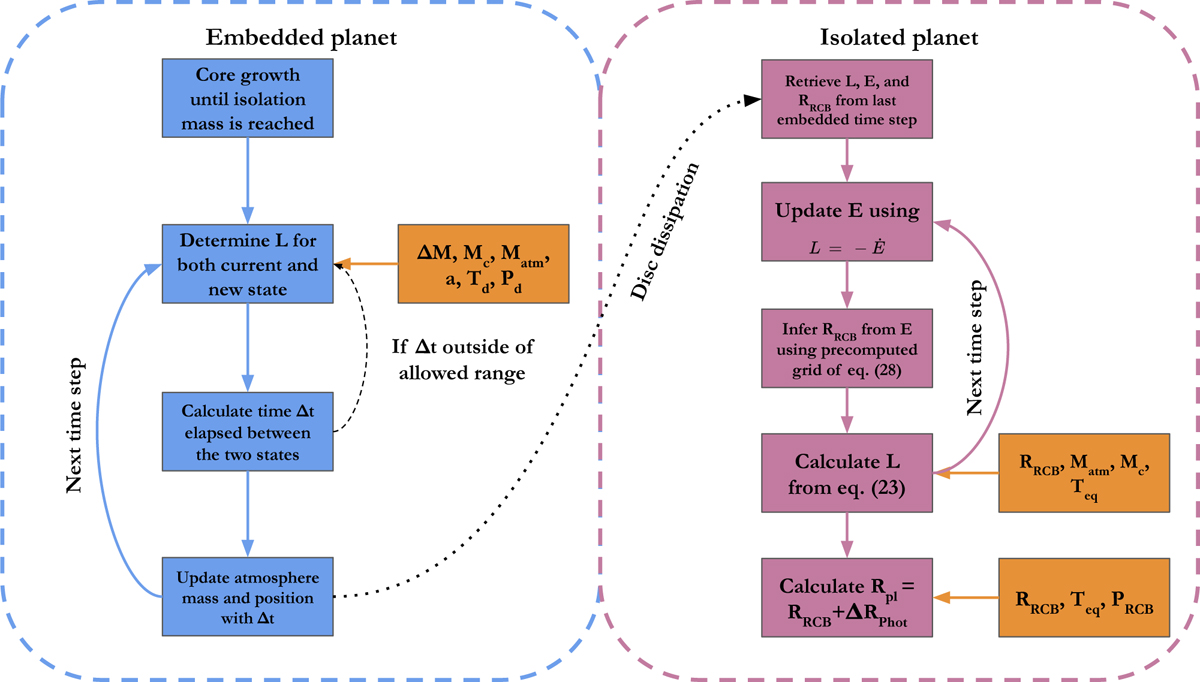
Flowchart of our procedure for calculating the accreted gas when the planet is embedded in the disc (left). We also show our method for calculating the rate of contraction after disc dissipation (right). The orange boxes show the input parameters going into each calculation. The main loops are shown as solid arrows in their respective colors. The dashed arrow indicates that we check if the calculated Δt is within the allowed range and repeat the step with a new ΔMtot if it is not. The dotted arrow shows the transition from the embedded case to the isolated case after disc dissipation.
Current usage metrics show cumulative count of Article Views (full-text article views including HTML views, PDF and ePub downloads, according to the available data) and Abstracts Views on Vision4Press platform.
Data correspond to usage on the plateform after 2015. The current usage metrics is available 48-96 hours after online publication and is updated daily on week days.
Initial download of the metrics may take a while.