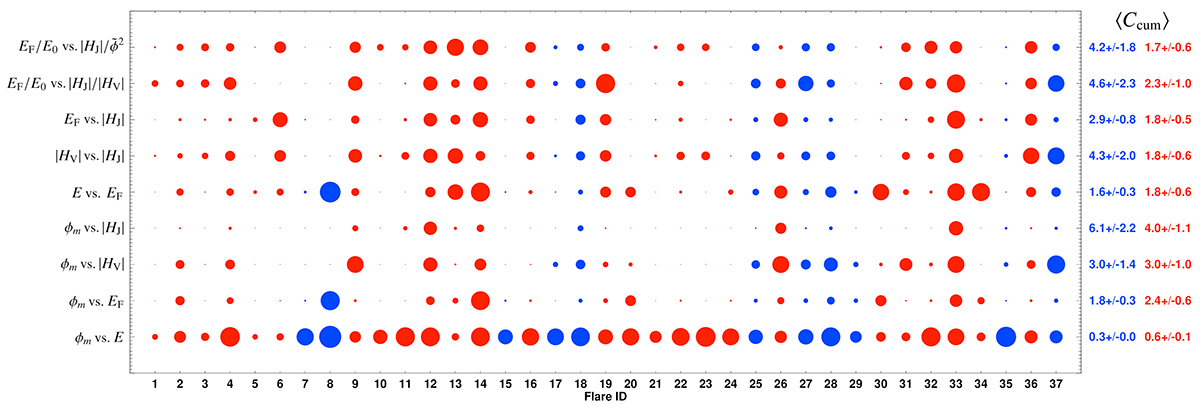
Fig. 7.
Download original image
Cumulative cost of pairs of variables (Ccum; shown as bullets), computed for the normalized preflare time profiles during the 24 hours leading to the flares of sample SSEA (flare ID is shown along of the x-axis and associated to specific flare events in the last column of Table A.1). The size of the plot symbols (bullets) relate to the inverse of Ccum, i.e., larger symbols indicate a larger similarity of two time profiles. Respective mean values, ⟨Ccum⟩, computed across all flares of a certain type are given to the right of the figure. Red and blue color indicate eruptive and confined flares, respectively.
Current usage metrics show cumulative count of Article Views (full-text article views including HTML views, PDF and ePub downloads, according to the available data) and Abstracts Views on Vision4Press platform.
Data correspond to usage on the plateform after 2015. The current usage metrics is available 48-96 hours after online publication and is updated daily on week days.
Initial download of the metrics may take a while.