Fig. 6.
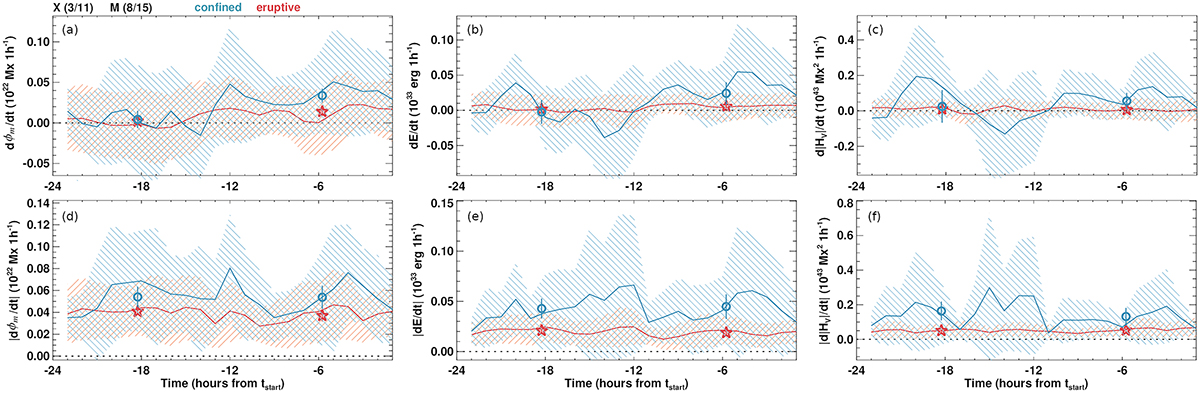
Download original image
Mean hourly variations (one-hour time gradient) in the overall preflare time evolution. Numbers in brackets indicate the ratio of confined to eruptive flares within the tested sample (SSEA). Mean values for confined (blue) and eruptive (red) flares, computed from the synthesized preflare time profiles are shown. The shaded regimes indicate the standard deviation. Covered is the 24 hours time period prior to the flare start time (tstart). The top panels show signed variations in the time evolution of the (a) unsigned magnetic flux (ϕm), (b) total energy E, and (c) unsigned total helicity (|HV|). Positive/negative values indicate an/a respective increase/decrease over time. The bottom panels (d–f) show the respective unsigned variations.
Current usage metrics show cumulative count of Article Views (full-text article views including HTML views, PDF and ePub downloads, according to the available data) and Abstracts Views on Vision4Press platform.
Data correspond to usage on the plateform after 2015. The current usage metrics is available 48-96 hours after online publication and is updated daily on week days.
Initial download of the metrics may take a while.