Fig. 4.
Download original image
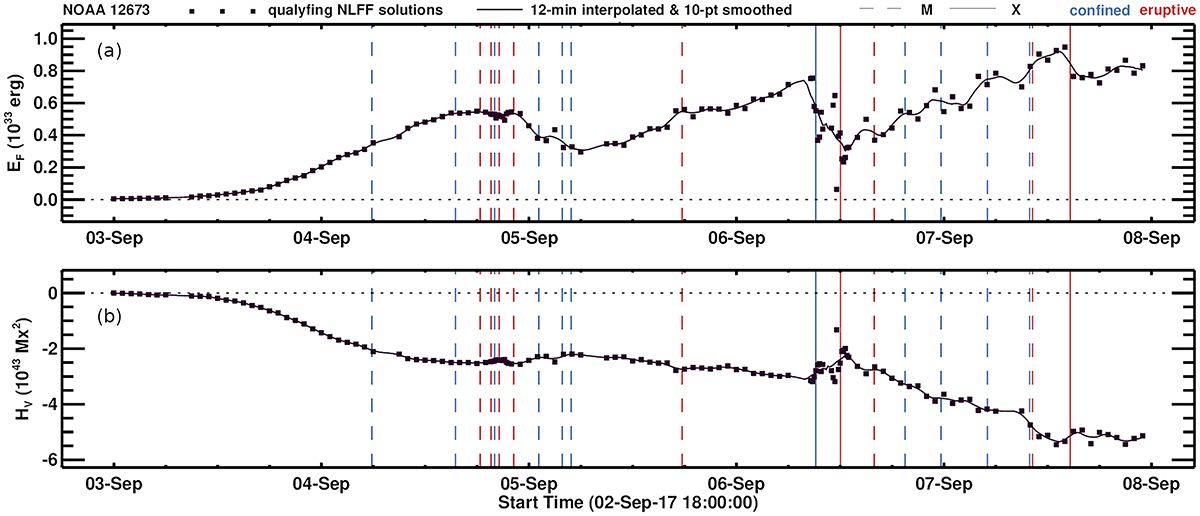
Time evolution of coronal quantities during disk passage of NOAA 12673. (a) Free magnetic energy (EF) and (b) total helicity (HV). The black line represents a fitting to the values computed from qualifying NLFF models (squares) onto a uniform time cadence (12-minutes). Solid and dashed vertical lines mark the GOES start time of X- and M-class flares, respectively. Blue and red color indicate the flare type (confined and eruptive, respectively).
Current usage metrics show cumulative count of Article Views (full-text article views including HTML views, PDF and ePub downloads, according to the available data) and Abstracts Views on Vision4Press platform.
Data correspond to usage on the plateform after 2015. The current usage metrics is available 48-96 hours after online publication and is updated daily on week days.
Initial download of the metrics may take a while.