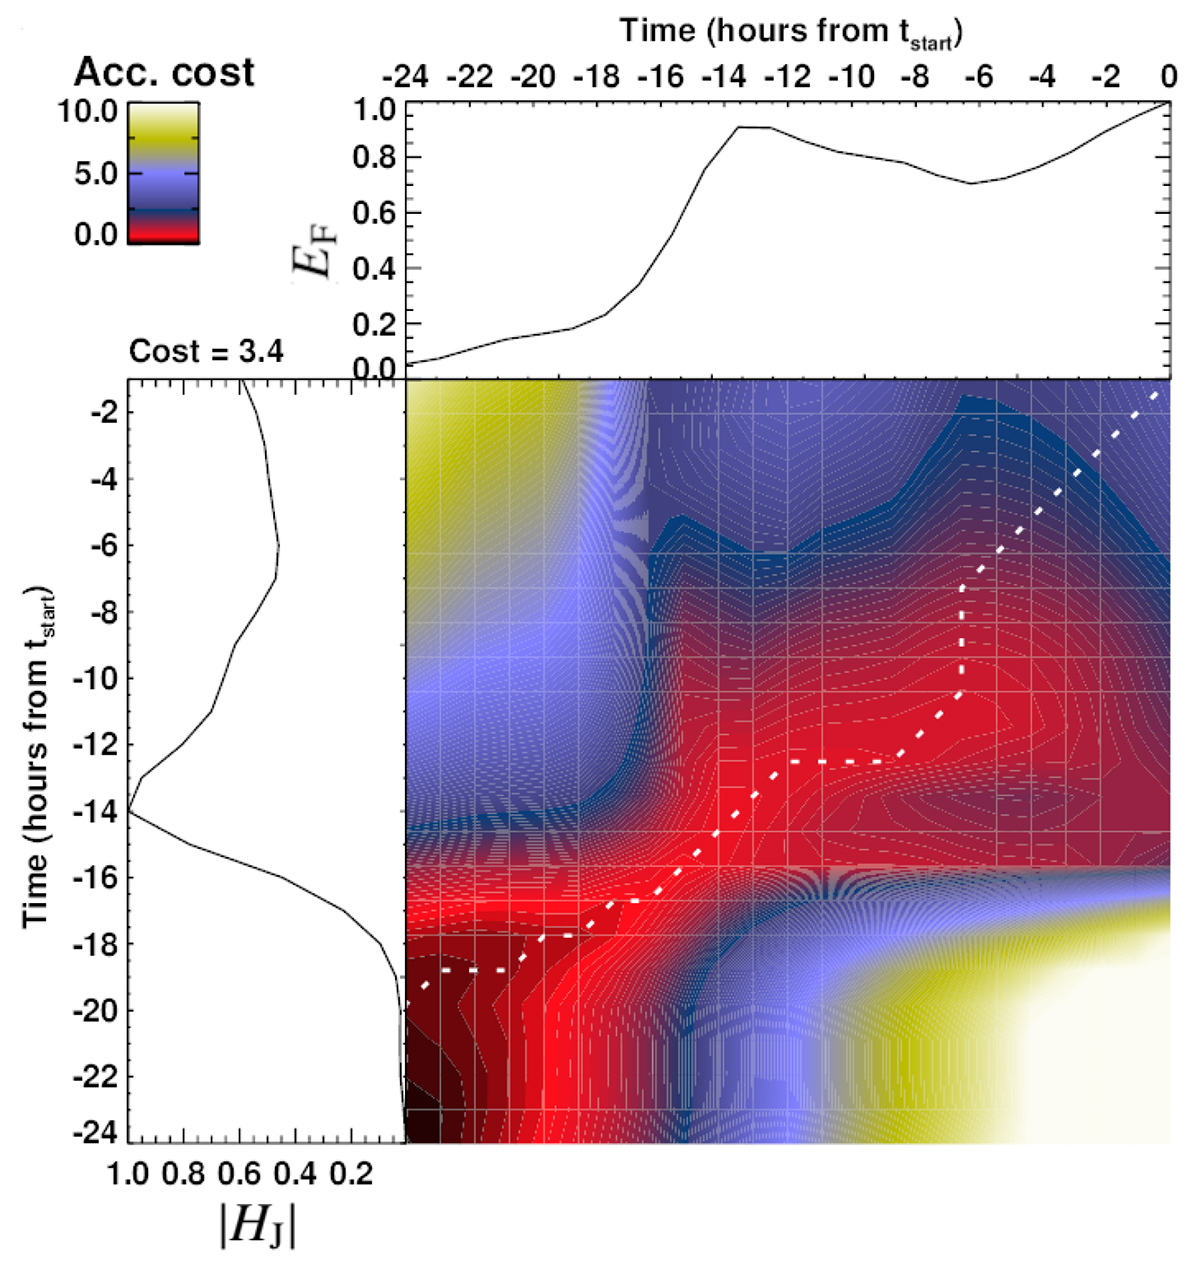
Fig. 3.
Download original image
Correlation analysis for the 24 hours leading up to the flare SOL2011-02-13T17:28M6.6. The normalized event epochs of the unsigned helicity of the current-carrying field (|HJ|) and the free magnetic energy (EF) are shown in the vertically and horizontally oriented line profile, respectively. The accumulated cost matrix is shown color-coded. The white dotted line represents the optimal (warping) path.
Current usage metrics show cumulative count of Article Views (full-text article views including HTML views, PDF and ePub downloads, according to the available data) and Abstracts Views on Vision4Press platform.
Data correspond to usage on the plateform after 2015. The current usage metrics is available 48-96 hours after online publication and is updated daily on week days.
Initial download of the metrics may take a while.