Fig. 2.
Download original image
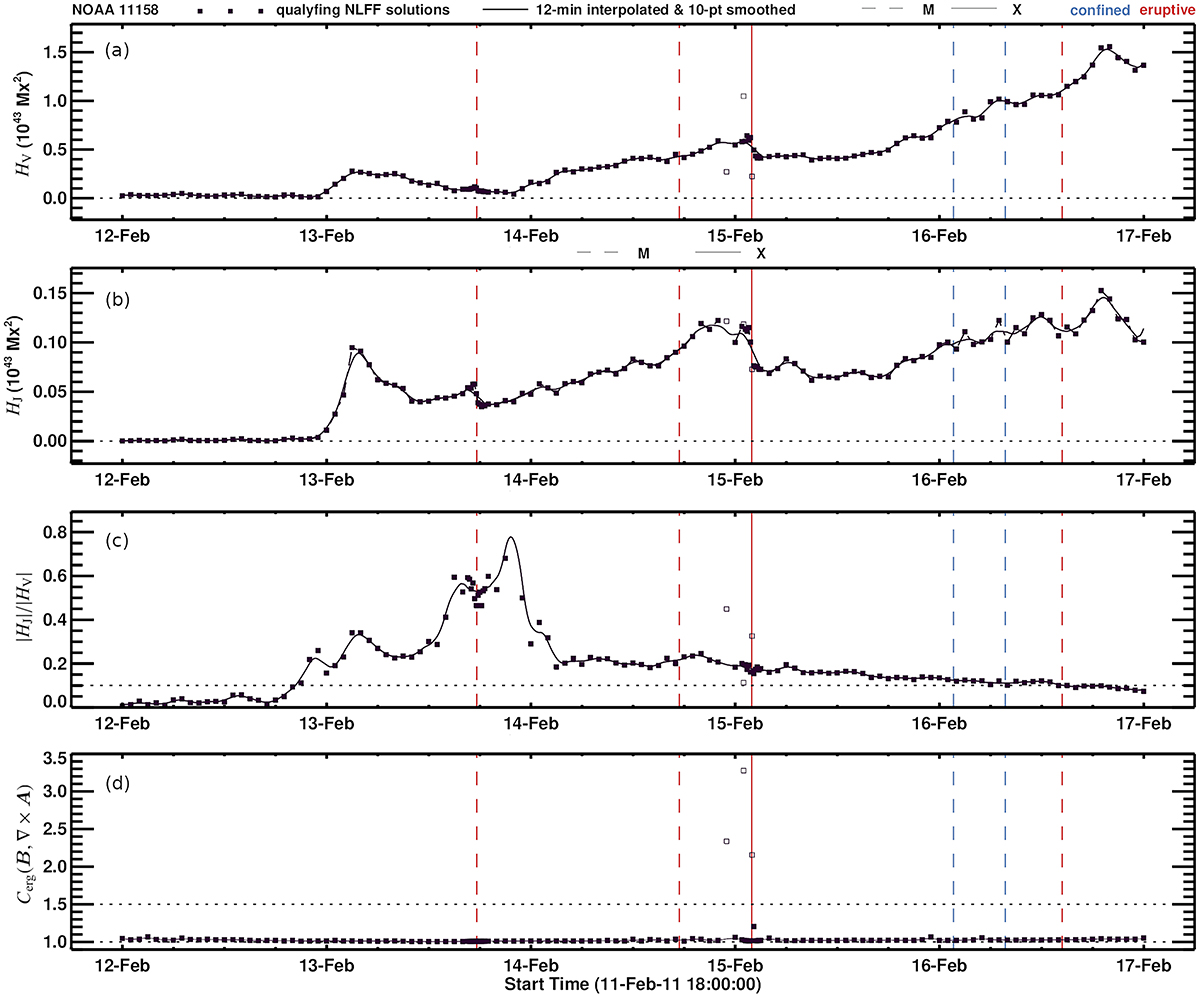
Time evolution of selected quantities during the disk passage of NOAA 11158. From top to bottom: the (a) total helicity (HV), (b) helicity of the current-carrying field (HJ), (c) helicity ratio (|HJ|/|HV|), and (d) the energy correlation (Cerg) of the pair (A, ∇ × B). (Dis-)Qualifying values are indicated by (empty) filled black squares. The black curve represents a fitting to the qualifying values onto a uniform (12-min) time cadence. Solid and dashed vertical lines mark the GOES start time of X- and M-class flares, respectively. Blue (red) indicates an confined (eruptive) flare type.
Current usage metrics show cumulative count of Article Views (full-text article views including HTML views, PDF and ePub downloads, according to the available data) and Abstracts Views on Vision4Press platform.
Data correspond to usage on the plateform after 2015. The current usage metrics is available 48-96 hours after online publication and is updated daily on week days.
Initial download of the metrics may take a while.