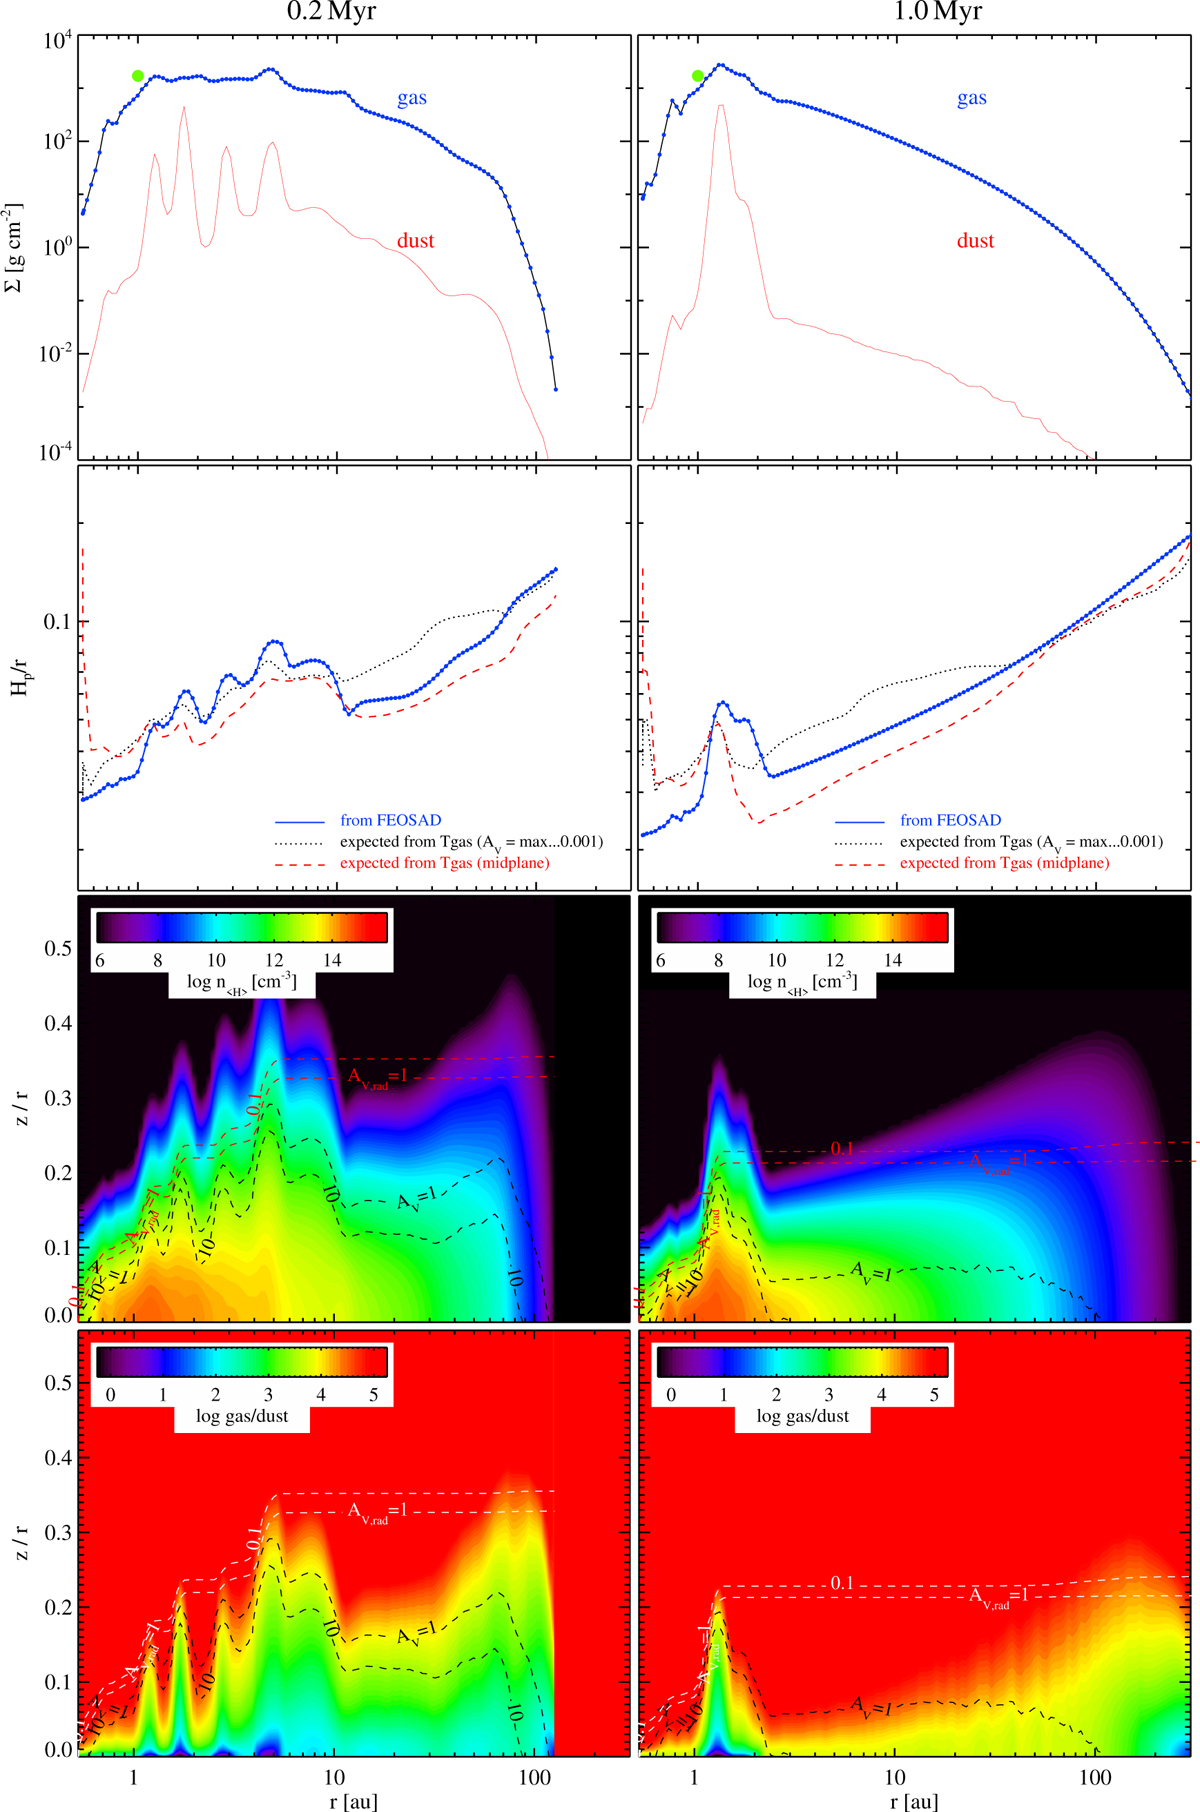
Fig. 2
Download original image
Disk structure of the WI-3a model after 0.2 Myr and one Myr. The upper plots show the gas and dust column densities, where the green dot marks the popular MMSN-value of 1700 g/cm2 at one au. The second row of plots shows the scale heights Hg(r) as passed from FEOSAD, and the values calculated from the gas temperatures calculated by PRODIMO, using either the midplane temperature only (red dashed) or the Tgas(ɀ) structure up to a height where the radial visual extinction is AV,rad = 0.001. The lower two rows show the hydrogen nuclei density n<H> and the gas-to-dust mass ratio. Additional contour lines show the radial and vertical optical extinctions, AV,rad and AV,ver, respectively.
Current usage metrics show cumulative count of Article Views (full-text article views including HTML views, PDF and ePub downloads, according to the available data) and Abstracts Views on Vision4Press platform.
Data correspond to usage on the plateform after 2015. The current usage metrics is available 48-96 hours after online publication and is updated daily on week days.
Initial download of the metrics may take a while.