Fig. 5
Download original image
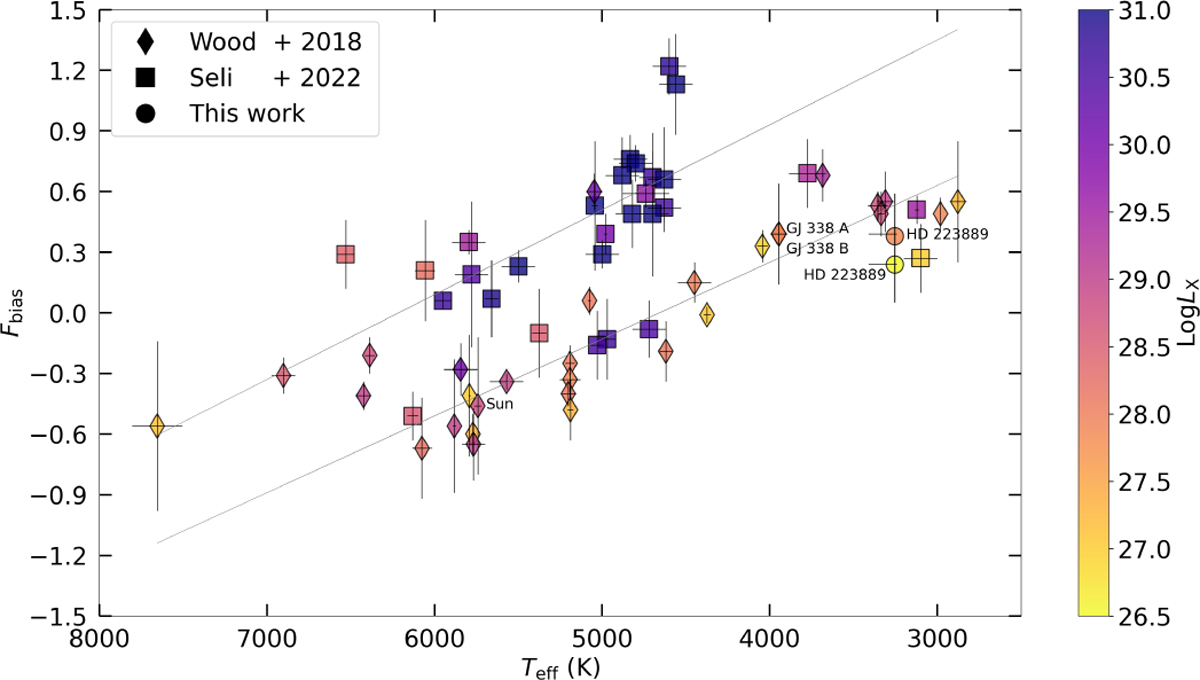
Diagram showing Teff – Fbias. The diamond symbols represent the stars from Wood et al. (2018) and the square symbol corresponds to the additional stars from the sample of Seli et al. (2022). The circles represent the Fbias of HD 223889 for the flare and the quiescent phase. Each data point is plotted with the corresponding error bars for the effective temperature (Teff) and the FIP bias value (Fbias). The two gray lines represent the fit of the lower and upper branches from Seli et al. (2022), Eqs. (2) and (4), respectively. The color-coded data points indicate log LX (X-ray luminosity), which is also taken as an activity indicator.
Current usage metrics show cumulative count of Article Views (full-text article views including HTML views, PDF and ePub downloads, according to the available data) and Abstracts Views on Vision4Press platform.
Data correspond to usage on the plateform after 2015. The current usage metrics is available 48-96 hours after online publication and is updated daily on week days.
Initial download of the metrics may take a while.